


Website Accessibility Statistics: ADA Lawsuits, Compliance, and WCAG Data (2026)
By Josh Ternyak

April 17, 2026
ADA website accessibility lawsuits increased 325% between 2017 and 2024. This comprehensive guide covers website accessibility lawsuit statistics, WCAG compliance rates, disability demographics, the business case for accessibility, and what legal and commercial exposure looks like in 2026.
Key Statistics: Website Accessibility
The Growing Website Accessibility Legal Landscape
Website accessibility has transitioned from a "nice to have" consideration to a legally enforced requirement for many businesses. The combination of rising lawsuit volume, DOJ rulemaking, and state-level legislation has created a legal environment where ignoring accessibility is a quantifiable business risk — not just an ethical gap.
Understanding the statistics behind accessibility lawsuits, compliance rates, and the user populations affected is essential for businesses trying to make informed decisions about accessibility investment. This guide covers all dimensions: the legal exposure, the compliance landscape, the user demographics, and the business case that goes beyond legal risk avoidance.
ADA Website Accessibility Lawsuits: Historical Trend
YearFederal ADA Web Lawsuits FiledYoY ChangeNotes2017814—Lawsuits begin significant growth20182,258+177%Winn-Dixie case raises awareness20192,256FlatDomino's Supreme Court appeal20202,523+12%COVID digital acceleration increases sites20214,011+59%Significant acceleration20223,255-19%Slight correction / legal changes20234,605+41%New record high2024~4,200 (est.)-9% (est.)Influenced by DOJ final rule
The trajectory from 814 lawsuits in 2017 to 4,605 in 2023 — a 465% increase — reflects several converging forces: growing legal awareness in the disability rights community, the rise of law firms specializing in serial ADA digital accessibility litigation (filing dozens or hundreds of cases per year), and the unprecedented expansion of digital commerce during and after COVID-19 that brought millions of consumers with disabilities into digital channels who previously accessed services in person.
In 2024, the Department of Justice issued a final rule specifying that WCAG 2.1 AA is the required standard for state and local government websites under ADA Title II. While this specific rule targets government sites, it significantly strengthens the legal foundation for Title III claims against private businesses — establishing WCAG 2.1 AA as the legal yardstick even in non-government contexts.
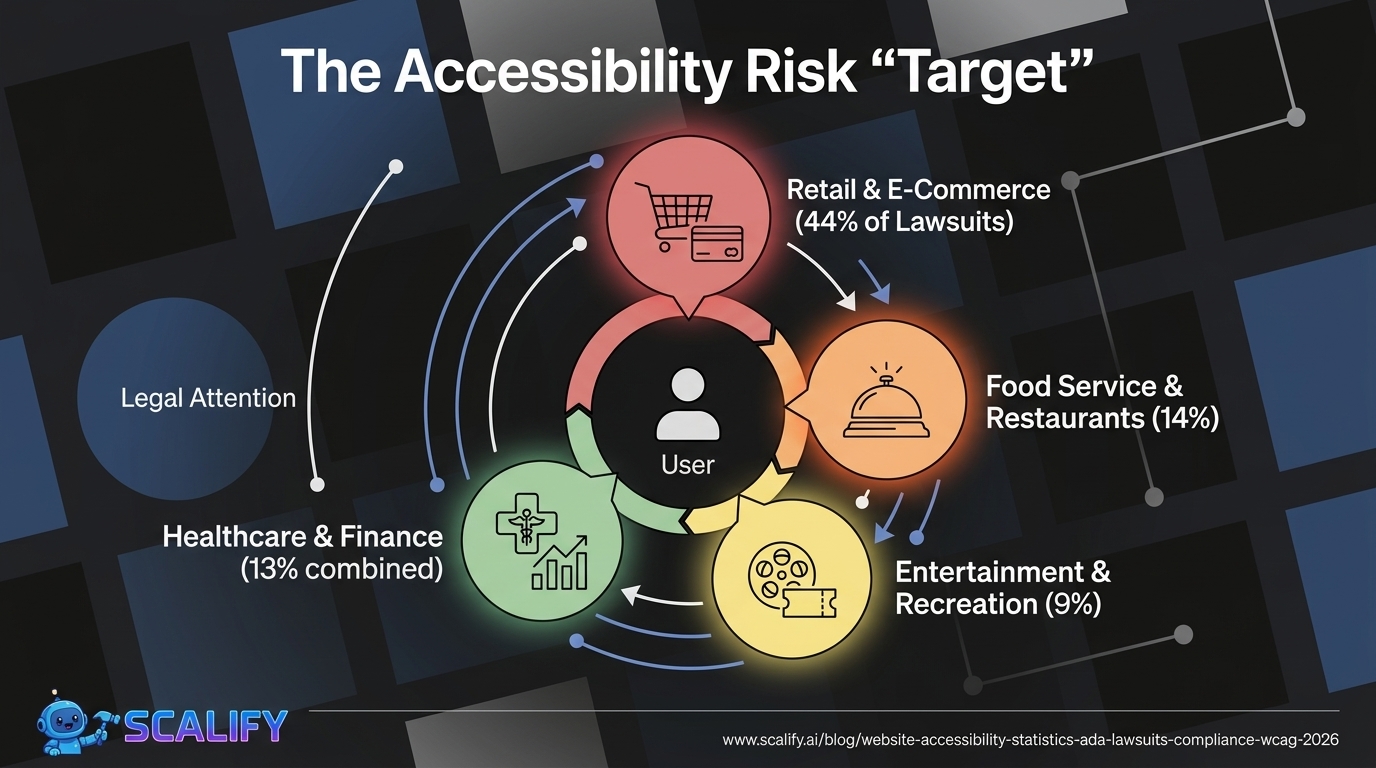
ADA Lawsuit Targets: Who Gets Sued
Business Category% of ADA Web LawsuitsNotesRetail / E-Commerce~44%Highest target categoryFood Service / Restaurants~14%Ordering, reservations, menusEntertainment / Recreation~9%Ticketing, event bookingHealthcare~7%Patient portals, appointment bookingFinancial Services~6%Online banking, applicationsTravel / Hospitality~5%Hotels, airlines, booking sitesEducation~4%E-learning, school websitesReal Estate~3%Property listings, virtual toursOther industries~8%Distributed across all sectors
E-commerce's dominance as an ADA lawsuit target (44%) reflects both volume — there are more e-commerce sites than any other category — and the specific user experience barriers that e-commerce creates for users with disabilities: image carousels without text alternatives, form fields without labels, checkout flows that rely entirely on visual cues, and color contrast failures in purchase buttons. The functional stakes are also higher — a person with a visual impairment who cannot complete a purchase is experiencing a concrete, quantifiable discrimination in commercial participation.

The Financial Cost of ADA Accessibility Lawsuits
Cost ComponentAmount RangeSettlement amount (out of court)$25,000 – $150,000Legal defense costs (to trial)$50,000 – $250,000+Court judgment (adverse)$75,000 – $500,000+Attorney fees (if plaintiff prevails)$20,000 – $100,000+Website remediation costs (post-lawsuit)$5,000 – $50,000+Reputational / brand damageDifficult to quantifyRepeat lawsuits (serial litigants)Each counted separately
The settlement range of $25,000–$150,000 for a single accessibility lawsuit is the cost that most businesses haven't budgeted for — because most haven't considered their accessibility compliance status. For comparison, proactive accessibility remediation of a typical small-to-medium business website costs $3,000–$15,000. The lawsuit cost-vs-prevention math is unambiguous.
An important nuance: "serial litigation" firms file accessibility lawsuits against dozens or hundreds of businesses simultaneously. These firms may send demand letters with settlement amounts of $5,000–$25,000 — explicitly priced below the cost of legal defense to make settlement the rational economic choice. Many small businesses have received these demand letters without any prior awareness that they had an accessibility issue. The volume of these demand letters — legal notices preceding formal lawsuits — significantly exceeds the 4,605 formally filed lawsuits.
WCAG Compliance: How Most Websites Actually Perform
WCAG Compliance MetricDataSource% of homepages failing WCAG 2.1 AA96.3%WebAIM Million Report 2023Avg number of WCAG errors per homepage50.8 errorsWebAIM Million Report 2023% of pages with detectable errors96.3%WebAIM Million ReportWCAG errors per page (1 million site average)Increasing YoYWebAIM annual tracking% of pages with low contrast text83.1%WebAIM Million 2023% of pages with missing alt text58.2%WebAIM Million 2023% of pages with empty links50.1%WebAIM Million 2023% of pages with missing form labels45.9%WebAIM Million 2023% of pages with missing document language17.7%WebAIM Million 2023
The WebAIM Million report — an annual automated accessibility audit of the top 1 million websites — is the most authoritative snapshot of real-world WCAG compliance. The 96.3% failure rate with an average of 50.8 errors per homepage is a damning statistic — but automated testing only catches approximately 30–40% of WCAG issues. The true accessibility gap is significantly larger than even these alarming numbers suggest.
The Most Common WCAG Failures
WCAG Failure Type% of Homepages AffectedWCAG CriterionLow color contrast text83.1%WCAG 1.4.3Missing alternative text for images58.2%WCAG 1.1.1Empty or unlabeled links50.1%WCAG 2.4.4Missing form input labels45.9%WCAG 1.3.1Missing document language17.7%WCAG 3.1.1Empty button text27.5%WCAG 4.1.2Missing skip navigation~70%WCAG 2.4.1
The 83.1% color contrast failure rate is both the most common WCAG failure and one of the most easily prevented. WCAG 2.1 AA requires a contrast ratio of at least 4.5:1 for normal text and 3:1 for large text. Many designers choose visually appealing light gray text on white backgrounds, or use brand colors that happen to fail the contrast test — without ever checking compliance. Free browser extensions (WAVE, axe DevTools) and contrast checker tools catch these failures in seconds. The fact that 83% of top websites still fail this check suggests it's simply not being verified during the design and build process.
Disability Demographics: Understanding the User Population
Disability TypeUS Adults AffectedPrimary Web ImpactMobility/physical disability~12.1 million (5.5%)Cannot use mouse — keyboard nav requiredCognitive/learning disability~10.8 million (4.9%)Complex language, time-limited sessionsVision impairment (not blind)~21.2 million (8.1%)Low contrast, small text, magnificationBlind / severe vision impairment~3.2 millionScreen reader dependentHearing impairment / deaf~15.5 millionVideo captions, audio transcriptsTotal adults with any disability (US)~61 million (26%)Multiple overlapping needs
The scope of the affected user population is larger than most businesses realize. The 26% of US adults with some form of disability is not an edge case — it represents over 61 million potential customers. When you add situational disabilities (bright sunlight making screens hard to read, broken arm requiring non-dominant hand navigation, watching video in a quiet environment without headphones) the population affected by poor accessibility at any given moment is even larger.
The Business Case for Accessibility: Beyond Legal Risk
Business BenefitDataSourceRevenue from disability market (US)$490 billion annual disposable incomeAmerican Institutes for ResearchOrganic traffic increase from accessibility (SEO overlap)+73% average increaseSEMrush Accessibility StudyOverall usability improvement for all users+35% average improvementMicrosoft Inclusive Design Research% of disabled users who leave inaccessible sites immediately71%Click-Away Pound SurveyAnnual lost e-commerce revenue from inaccessible sites$828 million (UK alone)Click-Away Pound ReportAccessible sites: customer loyalty from disabled users73% more likely to returnForesight Research
The $828 million in annual lost e-commerce revenue in the UK alone is a striking commercial argument for accessibility. This figure — from the Click-Away Pound Survey research — quantifies the spending of disabled users who abandon shopping sites because of accessibility barriers and spend with competitors instead. The US equivalent, scaled by market size, exceeds $5 billion annually in e-commerce revenue lost due to accessibility failures.
The 73% increase in organic search traffic from accessibility-related improvements is not coincidental — the overlap between accessibility best practices and SEO best practices is extensive. Alternative text on images helps screen reader users and provides image SEO. Heading hierarchy helps screen reader navigation and helps Google understand page structure. Descriptive link text helps blind users understand where links go and helps Google understand content context. Caption files for video help deaf users and provide searchable text for Google to index. Accessibility work and SEO work often accomplish the same improvements through the same technical changes.
Overlapping Benefits: Accessibility and SEO
Accessibility Best PracticeSEO BenefitAlt text on imagesImage search ranking, content contextProper heading hierarchy (H1, H2, H3)Content structure signal to GoogleDescriptive link text (not "click here")Internal linking anchor text, contextVideo captions/transcriptsIndexable text content for video pagesLogical tab order / keyboard navigationCrawlable page structureFast page load (required by mobile accessibility)Core Web Vitals / ranking factorSufficient color contrastIndirect (better UX → lower bounce rate)ARIA labels on interactive elementsStructured data context
What WCAG Compliance Levels Mean
WCAG LevelDescriptionLegal RelevanceWCAG 2.1 A (minimum)Basic accessibility, highest impact barriers removedInsufficient for legal compliance in most jurisdictionsWCAG 2.1 AA (standard)Standard commercial accessibility, addresses major barriersThe legal standard (ADA, EU accessibility directive, DOJ rule)WCAG 2.1 AAA (highest)Maximum accessibility, some requirements impractical at scaleNot required by any regulation; aspirationalWCAG 2.2 AA (current)Updated 2023, adds mobile and cognitive focus criteriaIncreasingly referenced in newer regulations

How to Prioritize Accessibility Improvements
For businesses starting accessibility remediation, research consistently supports prioritizing in this order based on user impact and legal exposure:
Priority 1 — Eliminate the most common WCAG failures: Color contrast correction, alt text for all informational images, form field labels, and descriptive link text. These five issues account for 80%+ of automated WCAG failures and can typically be addressed within a few days of focused remediation work. They also eliminate the most common barriers for screen reader users and keyboard navigation users.
Priority 2 — Keyboard accessibility: Ensure all interactive elements (buttons, forms, menus, modals) are fully operable with keyboard alone. Many mobility-impaired users rely exclusively on keyboard navigation. Tab order should follow visual reading order. Focus states must be visible (the outline is intentional, not a bug to suppress).
Priority 3 — Semantic HTML and ARIA: Use proper HTML elements (button vs. div, nav vs. div, main, header, footer) to convey structure to assistive technologies. Add ARIA labels where native semantics are insufficient. This is the foundation that screen readers depend on to make sense of a web page.
Priority 4 — Media accessibility: Add captions to all video, transcripts for audio content, and audio descriptions for video where the visual content conveys information not in the audio.
At Scalify, the websites we build are constructed with WCAG 2.1 AA accessibility as a default design and development requirement — not an optional add-on. Accessible websites serve more users, rank better in search, and avoid the growing legal exposure that 96.3% of websites currently carry.
Top 5 Sources


.jpeg)

.jpeg)


78 SW 7th St, Miami, FL 33130


