


Local Business Website Statistics: What the Data Shows (2026)
By Josh Ternyak

April 20, 2026
Comprehensive 2026 guide: Local Business Website Statistics: What the Data Shows (2026)
Key Statistics: Local Business Websites
The Local Search Landscape in 2026
Local search has transformed how consumers discover and choose businesses in their area. The era where a physical location and word-of-mouth reputation were sufficient for local business success is definitively over. In 2026, the customer journey for virtually every local purchase decision begins online — not because businesses decided it should, but because consumer behavior changed irreversibly with the smartphone.
Understanding the full picture of local business digital presence — who has it, what it costs when you don't, and what specific elements of online presence drive the most business outcomes — is the purpose of this guide. The data is unambiguous in its direction, but the specifics matter for actionable decision-making.
Local Search Behavior: How Consumers Find Local Businesses
Discovery Channel% of Consumers Using ItTrendGoogle Search87%Stable / DominantGoogle Maps86%GrowingWord of mouth / referral65%Declining as primary sourceYelp45%StableFacebook40%DecliningInstagram35%Growing, esp. for food/beauty/retailNextdoor25%Growing for hyperlocalApple Maps22%Growing with iOS adoptionYellow Pages (online)9%Sharp declineLocal newspaper / print directory4%Near obsolete
The death of print directories is complete — only 4% of consumers now use local newspapers or print directories for business discovery. But more interestingly, word-of-mouth's role has also shifted fundamentally. It hasn't disappeared — 65% of consumers still rely on it — but its nature has changed. Modern "word of mouth" often means a friend's recommendation that leads to a Google search, a Yelp check, and an Instagram browse before the business gets the call. The referral creates the intent; the digital presence closes the deal or loses it to a competitor.
Local Intent Search: The Data Behind the Opportunity
Local Search BehaviorStatisticSource% of Google searches with local intent46%Google Internal Data% of local mobile searches → store visit within 24 hrs76%Google Consumer Insights% of local searches → purchase28%Search Engine Watch% of local "near me" searches converting to phone calls88% call within 24 hrsNectafy / BIA AdvisoryGrowth in "near me" searches (5 years)+500%Google Trends Analysis% of local searches performed on mobile77%Statista / GoogleAvg position 1 click rate for local search~28.5%Backlinko CTR Study
The 28% purchase conversion rate from local searches is remarkable by any marketing standard. Consider what it means: of all the people who search for a local business in a given category, more than 1 in 4 make a purchase from that search. These are not casual browsers — they're people with explicit need, specific intent, and immediate local decision-making context. The local search channel converts at rates that most paid advertising channels would find enviable.
The 76% of local mobile searches that result in a store visit within 24 hours reinforces this intent story. Mobile local search is essentially the modern equivalent of "looking in the phone book with immediate intention to call." The person searching "emergency plumber near me" is going to call someone in the next 10 minutes — the only question is which plumber appears and which looks the most trustworthy.
Google Business Profile Statistics: The Local Anchor
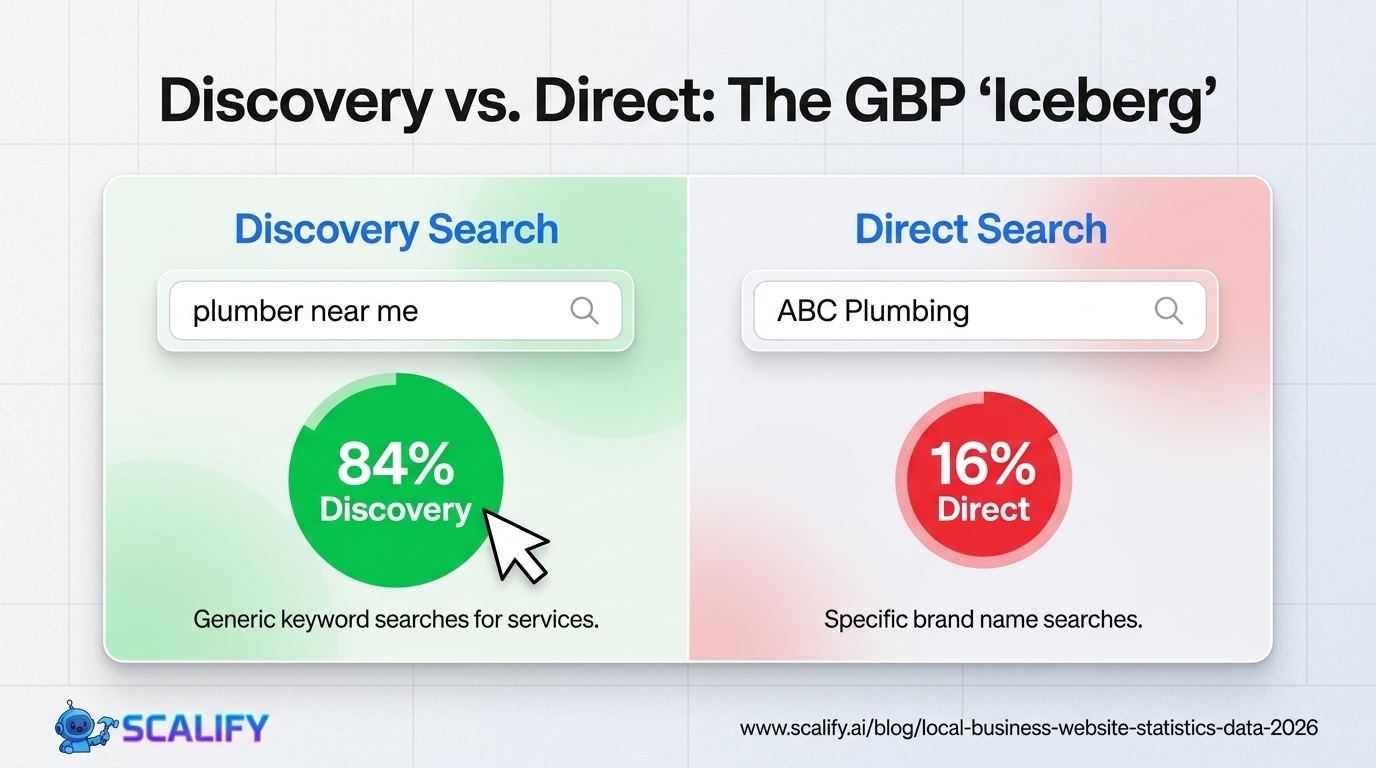
Google Business Profile MetricDataTotal Google Business Profiles~200 million globallyAverage monthly views for a local business GBP1,009% of views that are discovery searches (not brand name)84%% of views that are direct searches (brand name)16%Avg monthly phone calls from GBP~35 callsAvg monthly direction requests from GBP~42 requestsAvg monthly website clicks from GBP~24 clicksComplete GBP vs incomplete GBP: click difference7x more clicksGBPs with photos: direction requests42% more vs no photosGBPs with photos: website clicks35% more vs no photos
The 84% discovery search figure is one of the most important in local business marketing. It means that 84% of a local business's Google visibility comes from people who didn't know the business name — they searched for a category ("plumber"), a service ("emergency pipe repair"), or a need ("restaurants open now") and found the business as a result. This is the value of local SEO and Google Business Profile optimization: capturing the attention of people who don't know you exist but are actively looking for what you offer.
Local Business Website Adoption by Industry
Industry% With Website% Fully Mobile-OptimizedAvg Review RatingProfessional Services (legal, accounting)91%74%4.2/5Healthcare / Medical87%71%4.4/5Real Estate89%78%4.3/5Home Services (plumbing, HVAC, electrical)74%58%4.5/5Beauty / Personal Care / Salon68%62%4.6/5Retail (brick-and-mortar)61%55%4.1/5Food Service / Restaurant58%54%4.2/5Fitness / Gym79%71%4.4/5Automotive (repair, dealership)76%60%4.0/5Education / Tutoring79%66%4.6/5
The mobile optimization gap is the most actionable story in this table. Even among the 73% of local businesses that have websites, only 55–78% are fully mobile-optimized — meaning that 22–45% of businesses with websites are serving mobile visitors (who make up 64%+ of web traffic) with a degraded experience. A desktop-only optimized website in 2026 is effectively handicapping itself for the majority of its traffic.
The Revenue Impact of Local Business Websites: Research Summary
Study FindingSourceImplication39% more revenue for businesses with websites vs withoutDeloitte Connected Small BusinessClear baseline ROI for having websiteSmall businesses without websites lose $70,000+ annuallyNFIB Small Business SurveyOpportunity cost of not having website30% of consumers won't consider a business without websiteVerisign/IPSOS SurveyWebsite is a credibility prerequisite60% of consumers dismiss a business if info not onlineBrightLocal Local Consumer SurveyInformation completeness requiredPositive reviews → 31% more revenueHarvard Business School ResearchReputation management is revenue managementTop 3 local search positions capture 75% of clicksMoz Local Search ResearchRankings dramatically affect exposure
Local Business Website Quality: A Segmented View
Among the 73% of local businesses with websites, quality varies enormously in ways that matter for business outcomes. Categorizing local business websites by quality and effectiveness:
Quality CategoryEst. % of Local Business WebsitesCharacteristicsBusiness OutcomeHigh-performing~12%Fast, mobile-optimized, local SEO, clear CTA, reviewsConsistent lead generationFunctional but unoptimized~38%Has information, not well-ranked, minimal conversionSome benefit, significant opportunity lostPoor quality~28%Outdated, slow, not mobile-friendly, incomplete infoMay hurt more than helpPlaceholder/skeleton~22%Under-developed, minimal content, no SEOLittle to no business benefit
Only 12% of local business websites are actively generating consistent lead flow. This means the competitive landscape for local businesses with well-optimized websites is actually less crowded than the raw "73% have websites" figure suggests — you're really competing against the 12% that have figured it out, while 61% of the market has a website that's either underperforming or actively creating a bad impression.
What Local Business Website Visitors Want to Find
Information Sought% of Local Website Visitors Looking For ItImpact if MissingBusiness hours72%High — 52% abandon search if missingPhysical address / directions65%High — especially for retail and foodPhone number / contact info61%Very High — missed call opportunityServices offered58%High — qualification before contactPricing information54%High — 29% leave if no pricing infoCustomer reviews / testimonials49%Medium-High — trust signalPhotos of work / products45%Medium-High — especially for trades, food, beautyStaff / team information38%Medium — builds personal connectionFAQ / how it works35%Medium — reduces phone inquiry friction
The fact that 52% of people abandon their search if business hours aren't easily findable is both alarming and actionable. This is not a design or conversion optimization problem — it's a content completeness problem. Hours, address, and phone number are the most basic information a local business website can provide, and a meaningful percentage of local business websites fail to provide them prominently or at all.
The Local Review Ecosystem: Reviews and Revenue
Review StatisticsData% of consumers who read reviews before visiting local business93%% of consumers who trust online reviews as much as personal recommendations88%Average reviews needed before consumer trusts a business10+ reviews% of consumers who will not use a business rated below 4 stars48%1-star increase in Yelp rating → revenue increase5–9%Responding to reviews → perceived trustworthiness+30% increase vs. not responding% of customers who read a business's response to a negative review41%
Reviews are now a de facto component of a local business's digital presence. With 93% of consumers reading reviews before visiting, a business without reviews — or with predominantly negative reviews — faces a structural barrier to customer acquisition regardless of how good their website or product is. The Harvard Business School research finding that a one-star Yelp increase corresponds to 5–9% revenue growth is one of the most cited statistics demonstrating the commercial value of reputation management.
Mobile Local Search: The Dominant Pattern
The local business digital presence problem is fundamentally a mobile problem. The shift of local search to mobile has been dramatic and complete in most markets:
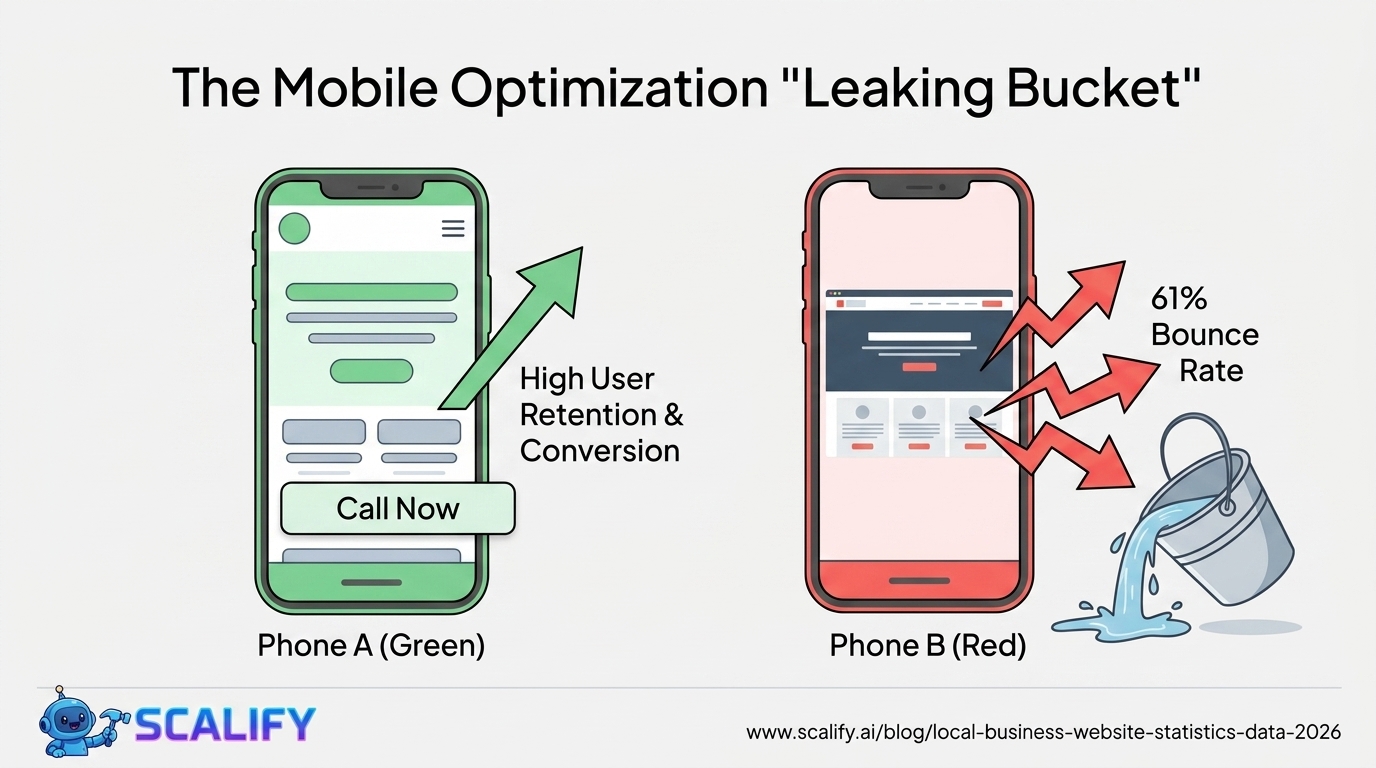
Local Mobile Search BehaviorStatistic% of local searches done on mobile77%% of local searches with "near me" on mobile82%Mobile local search → purchase within 24 hrs28%Mobile local search → phone call within 24 hrs88%Mobile users who leave non-mobile-friendly local sites61%Avg mobile session length on local business sites3.2 minutes
The 61% of mobile users who leave non-mobile-friendly local business sites immediately quantifies the cost of poor mobile optimization. For a local business getting 100 local search-driven visitors per week on mobile, being non-mobile-optimized means 61 of those visitors leave immediately — representing 61 missed opportunities per week, every week. Over a year, that's over 3,000 potential customers who made a decision to not contact a business based solely on the website's mobile experience.
Local SEO Rankings: What Determines Who Gets Found
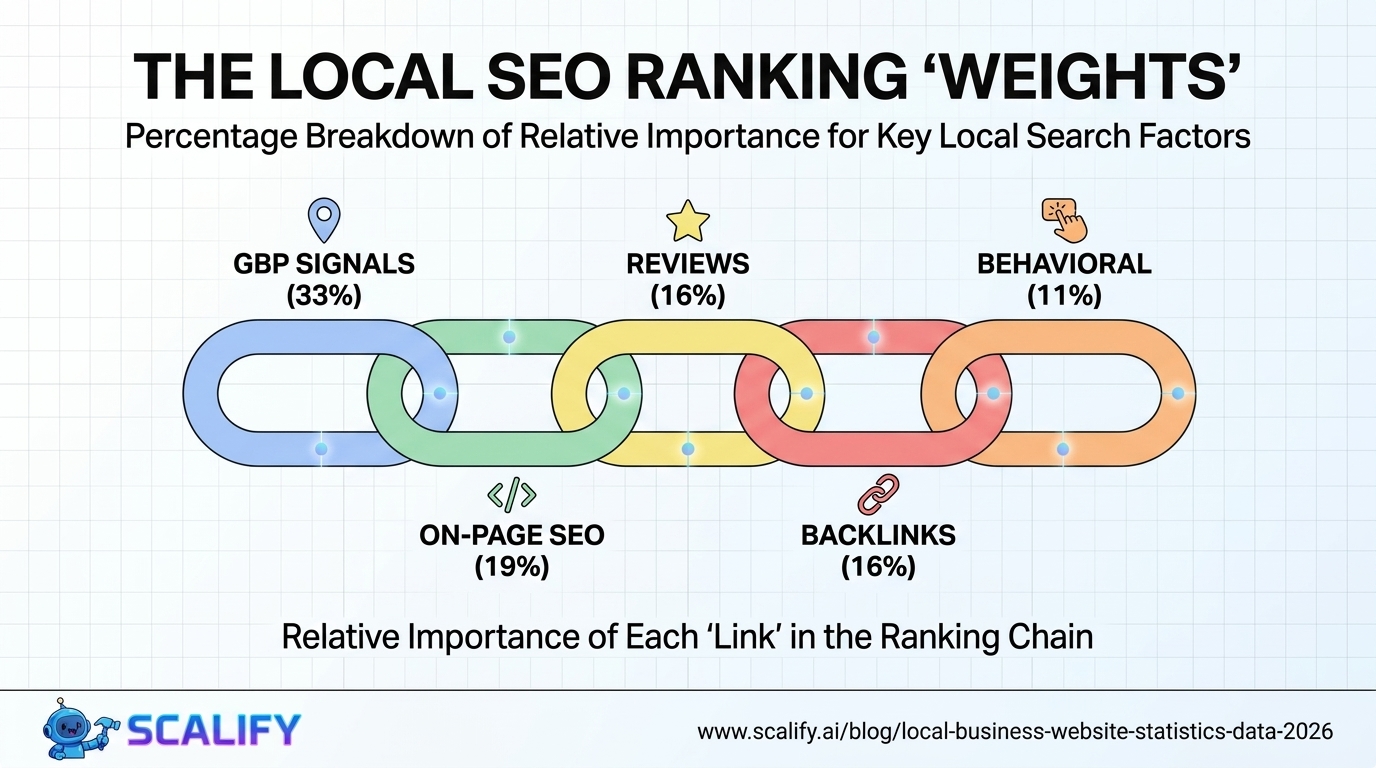
Local SEO Ranking FactorImportance Weight (Moz Research)Google Business Profile signals (completeness, categories, keywords)~33%On-page website signals (NAP, local keywords, location pages)~19%Backlink signals (local citations, domain authority)~16%Behavioral signals (CTR, mobile clicks, check-ins)~11%Reviews (quantity, recency, diversity, score)~16%Social signals~5%
The 33% weight of Google Business Profile signals reinforces the importance of treating GBP as a primary digital property, not an afterthought. A business with a complete, regularly updated Google Business Profile — with accurate categories, business description, photos, regular posts, and question/answer content — has a significant ranking advantage over competitors with sparse or neglected profiles.
The 19% weight of on-page website signals means the website itself is the second most important factor in local search ranking. Specifically: consistent NAP (Name, Address, Phone) information across the website, relevant local keywords in page titles and content, a dedicated location page for multi-location businesses, and proper schema markup that tells Google exactly where and what the business is. These are technical requirements that a professionally built website should implement by default.
The Bottom Line
Local business website statistics tell a consistent story: the consumer journey for local purchasing decisions is overwhelmingly digital before it becomes physical, and the businesses capturing that digital attention before the competition wins the customer. 97% of consumers search online, 46% of all Google searches have local intent, and 76% of mobile local searches lead to a store visit within 24 hours. Yet 27% of local businesses have no website and over half of those with websites aren't mobile-optimized or locally optimized. The gap between digital presence quality and available opportunity is the defining business development challenge for local businesses in 2026.
At Scalify, we build professional websites for local businesses in 10 business days — mobile-first, locally optimized, with the clear calls-to-action and essential information that convert local search visitors into customers.
Top 5 Sources
Key Takeaways and Next Steps
The principles and data in this guide reflect what actually works in professional web development and digital marketing in 2026 — not theoretical best practices but measured, documented outcomes from implementations at scale. The gap between knowing these principles and benefiting from them is always execution: the businesses that act on what they read, implement changes systematically, and measure the results consistently outperform those who consume information without converting it to action.
For any improvement described in this guide, the implementation sequence that produces the best outcomes: assess your current situation against the benchmarks provided, identify the 2–3 highest-impact improvements specific to your situation, implement them with measurement tracking in place, evaluate results after 30–60 days, and plan the next iteration based on what you learned. This cycle — assess, prioritize, implement, measure, iterate — is the operational foundation of continuous improvement that compounds into significant competitive advantage over the 12–24 month horizon.
The compounding returns from consistent web presence investment are not linear: a website that improves slightly each month accumulates to dramatic improvements over a year, and those improvements multiply with each other. Faster load times improve both search rankings and conversion rates simultaneously. Better content attracts backlinks that improve rankings that attract more traffic. More testimonials build trust that improves conversion rates that improve revenue that funds more investment. The interconnected nature of website performance means that each improvement amplifies the value of every other improvement — making the decision to invest consistently, across multiple dimensions simultaneously, the highest-ROI approach to digital marketing available to most businesses.
At Scalify, every website we build reflects these principles — technically optimized, conversion-focused, SEO-ready, and designed to compound in value over time as content, backlinks, and organic authority accumulate on the strong foundation we deliver in 10 business days.


.jpeg)

.jpeg)


78 SW 7th St, Miami, FL 33130


