


Video on Websites Statistics: Impact on Engagement and Sales (2026)
By Josh Ternyak

April 17, 2026
Comprehensive guide: Video on Websites Statistics: Impact on Engagement and Sales (2026)
Key Statistics: Video on Websites
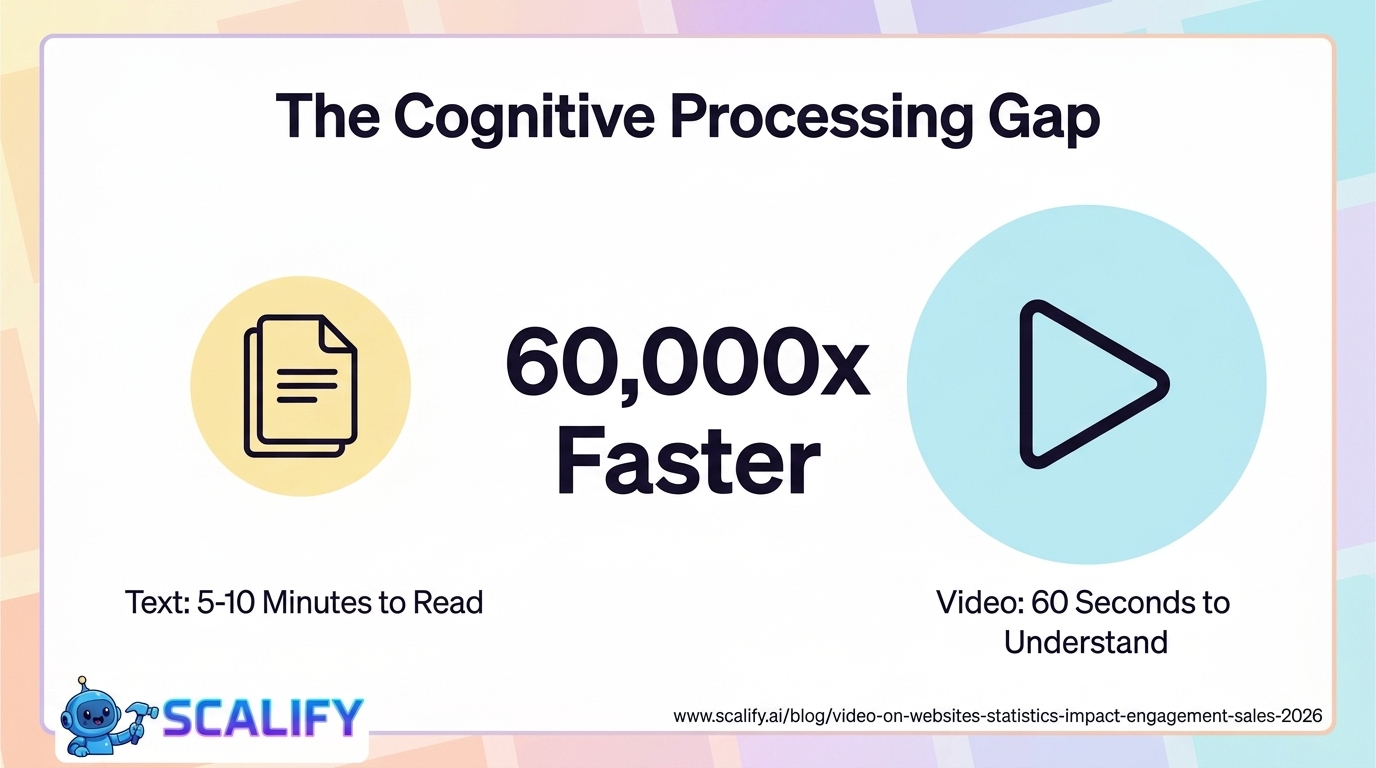
Why Video Impacts Website Performance So Dramatically
Video's outsized effect on website performance metrics isn't mysterious — it reflects how human cognition works. People process visual information 60,000 times faster than text. A 60-second video can communicate what would take 5–10 minutes to read, and it communicates through multiple channels simultaneously (voice, visuals, motion, music) that text simply cannot replicate. When a website visitor can watch a demonstration, hear a testimonial, or see a product in use, they're forming decisions on the basis of much richer information than any written description provides.
The commercial implications of this cognitive reality are significant and well-documented across independent research. But the statistics require context to be actionable — the 80–86% conversion increase from landing page video is a median across all contexts, and the actual impact for any specific business depends on video quality, placement, length, and alignment with visitor intent. This guide provides the full picture.
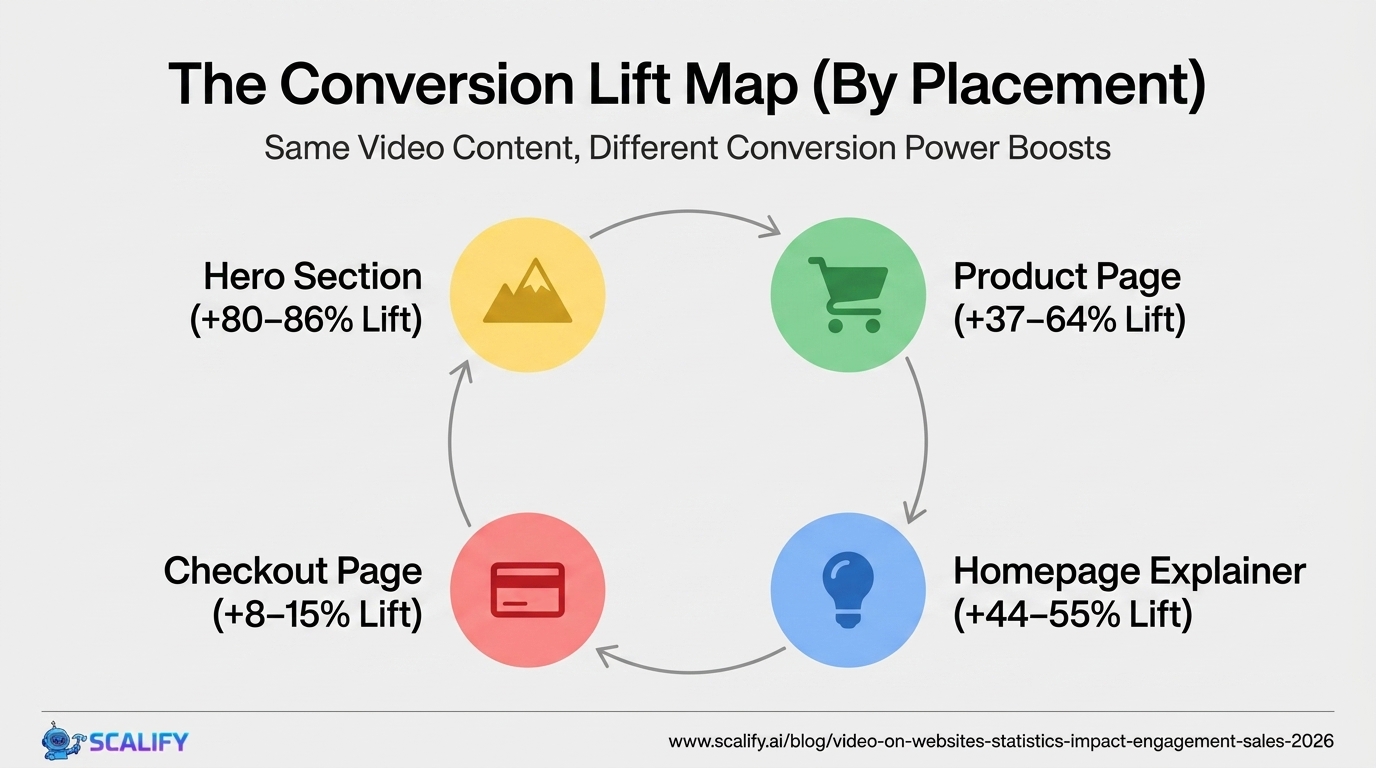
Video Impact on Conversion Rate: By Placement
Video PlacementAverage Conversion Rate LiftNotesHero video (landing page, above fold)+80 – 86%Highest impact placementProduct demo video (product page)+37 – 64%Strong for e-commerceExplainer video (homepage, service page)+44 – 55%Reduces confusion, builds confidenceTestimonial / customer story video+28 – 41%Trust signal amplified by videoPricing page video+25 – 38%Reduces price sensitivityFAQ / how-it-works video+20 – 32%Reduces support frictionCheckout page video+8 – 15%Reassurance at final decision point
The landing page hero video (+80–86%) is the most cited video conversion statistic, but it's worth examining what produces this effect. The lift doesn't come from any video — it comes from videos that: immediately address the visitor's primary problem, demonstrate the solution clearly, establish trust through authentic presentation, and do all of this in under 90 seconds. A low-quality, slow-paced, or off-message landing page video can actually reduce conversion rates by creating a bad impression before the visitor reads the written content.
Video Impact on Engagement Metrics
Engagement MetricImpact of Adding VideoSourceTime on page+2.6x (160% more time)Wistia ResearchBounce rate-34% average reductionEyeView DigitalPages per session+12 – 18% increaseBrightcove Video Marketing SurveyReturn visit rate+19% increaseAberdeen GroupSocial shares1,200% more shares than text+imageWordstream ResearchEmail CTR (video in email)+200 – 300% higher CTRCampaign MonitorInbound links to page3x more links vs text-onlyMoz Research
The 2.6x increase in time-on-page from video is significant beyond the obvious "people spend more time watching video than reading text" explanation. From a search engine perspective, dwell time (the time a visitor spends on a page after clicking from search results) is a behavioral signal that influences rankings. A page where visitors consistently spend 4 minutes instead of 1.5 minutes is sending a strong quality signal to Google — which partially explains the 41% more web traffic that Brightcove research found for video-equipped sites.
Video's SEO Impact: Why Google Loves Video
SEO Impact FactorStatisticMechanismFirst page ranking probability53x more likely (with video)Google owns YouTube; video content gets priorityOrganic search traffic increase+41% for video-equipped sitesDwell time, backlinks, rich resultsVideo rich results in SERP26% of search results contain videoVideo thumbnails increase CTR significantlyFeatured snippet probabilityHigher for instructional videoGoogle uses video for how-to queriesBacklinks earned vs text-only3x more inbound linksVideo is more shareable, referenced
The "53x more likely to rank on the first page" statistic requires context — it dates from a 2009 Forrester Research study and the current landscape is more nuanced. Google no longer automatically elevates video pages above text pages for all queries. What the current data consistently shows is more specific: pages with embedded video (especially YouTube video) earn more engagement, more backlinks, and better dwell time — all factors that contribute to better rankings through quality signals rather than a direct video ranking bonus.
Video Impact on E-Commerce and Product Sales
E-Commerce Video MetricDataSourceAdd-to-cart rate with product video+37% increaseZappos ResearchProduct return rate with video-25% reductionShopalytics / Explainer Video ResearchPurchase probability after watching product video+64% more likely to purchaseAnimoto Consumer SurveyShoppers who say video impacts purchase87%Wyzowl Video Marketing StatisticsRevenue increase with video vs without (e-commerce)+49% faster revenue growthAberdeen Group ResearchLuxury goods conversion with video+60% improvementInvodo Video Commerce Research
The 25% reduction in product returns with video is one of the most financially impactful (and underappreciated) video statistics in e-commerce. Returns cost retailers an average of $17.40 per order in processing costs, plus lost inventory time. A retailer with $5M in annual revenue and a typical 20% return rate spending $0.87M on returns could potentially reduce that to $0.65M with comprehensive product video — a $220,000 annual saving before counting the conversion rate improvements. Video pays for itself through both the front door (more sales) and the back door (fewer returns).
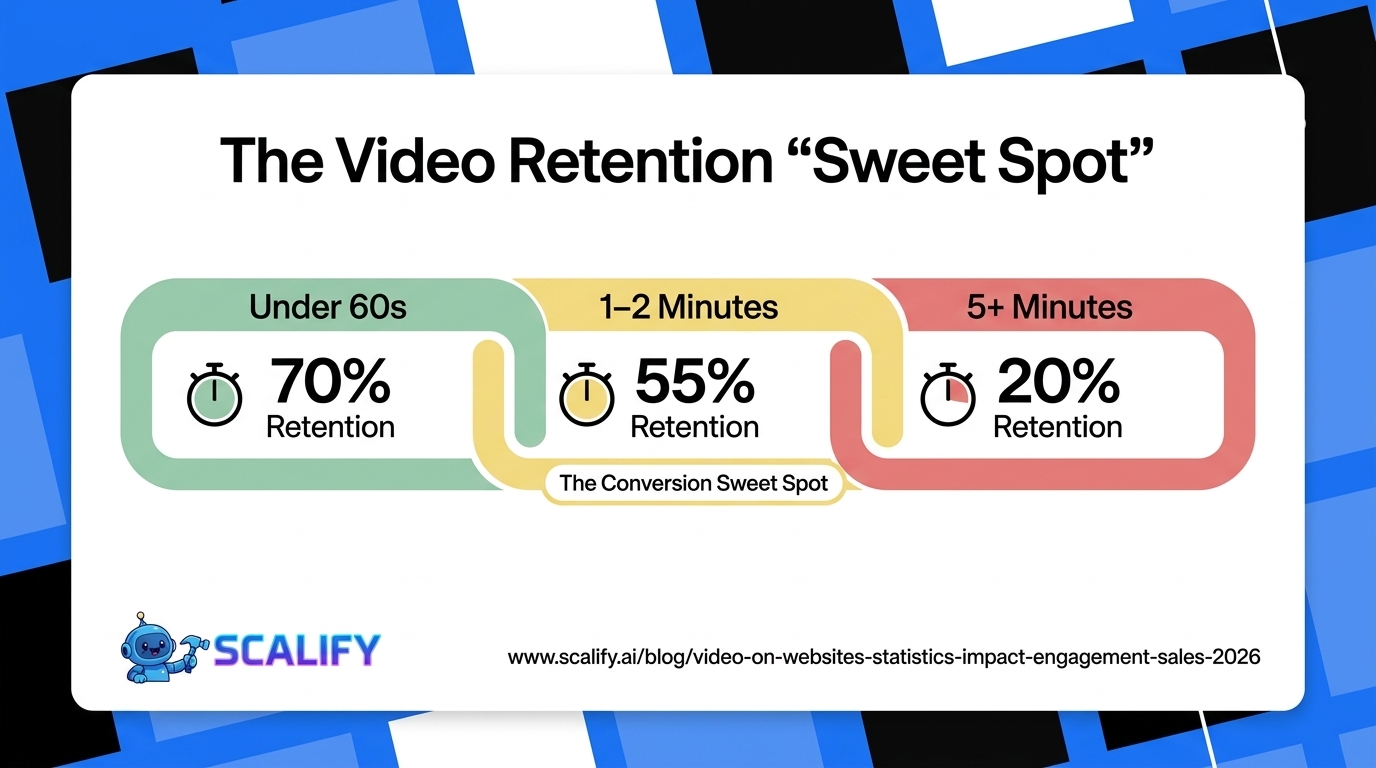
Video Length: What Research Says About Optimal Duration
Video LengthAvg Retention RateOptimal Use CaseUnder 30 seconds70% averageSocial media, intro clips, teasers30 – 60 seconds60% averageTestimonials, product highlights1 – 2 minutes50 – 55% averageExplainers, landing page hero videos2 – 5 minutes30 – 40% averageProduct demos, how-to content5 – 10 minutes15 – 25% averageIn-depth tutorials, case studies10 – 20 minutes10 – 20% averageEducational content, webinars
For website conversion-focused video, the 1–2 minute range consistently performs best. It's long enough to meaningfully communicate value, build some emotional connection, and address key objections — but short enough that most engaged visitors will watch substantially all of it. The 50–55% retention rate at 1–2 minutes means that if your video successfully hooks viewers in the first 15 seconds, approximately half will still be watching at the end of a 90-second video.
The counterintuitive finding from Wistia's research on video length: shorter isn't always better for engaged audiences. A 7-minute deep-dive product demo for a complex B2B product outperforms a 90-second overview if the visitor is a serious buyer in evaluation mode. The optimal video length for any specific use case depends on where in the buyer journey the visitor is — early-stage awareness warrants shorter, punchier video; late-stage evaluation warrants longer, more comprehensive content.
Video Production Budget vs. Impact
Production Budget RangeWhat You GetBest ForExpected ROI Tier$0 – $500 (DIY)Smartphone footage, basic editingTestimonials, behind-the-scenesModerate — authenticity can compensate$500 – $2,500 (Semi-pro)Proper camera, basic productionService explanations, team introsGood — significant step up$2,500 – $8,000 (Professional)Professional videographer, editingProduct demos, explainersStrong — professional quality baseline$8,000 – $25,000 (Premium)Agency production, animation possibleBrand films, homepage heroesVery Strong for high-value landing pages$25,000+ (High-end)Full agency, broadcast qualityEnterprise brand, major campaignsJustified for 7-figure marketing spend
The most common mistake in website video production: over-investing in production quality while under-investing in script quality. A beautifully shot video with a weak script that doesn't address visitor needs or objections underperforms a slightly rough but strategically sharp video that speaks directly to what visitors are trying to decide. Script and message strategy should receive at least equal budget to production execution.
Video Hosting Options and Their Impact on Performance
Hosting OptionPage Speed ImpactPrivacy / AnalyticsCostYouTube embeddedModerate negative (JS load)YouTube tracks everythingFreeVimeo embeddedModerate negativeBetter privacy, basic analytics$7 – $75/moWistiaOptimized for performanceFull analytics, heatmaps, no ads$19 – $79/moSelf-hosted (HTML5 video)High positive (no third-party JS)Full control, no analytics built-inBandwidth cost onlyCloudflare StreamGood performanceBasic analytics$5/1,000 min viewed
The video hosting choice has meaningful implications for both page speed (and therefore SEO) and for the insights available about viewer behavior. YouTube is free but inserts third-party JavaScript that slows page loads, serves competitor ads on your videos, and provides minimal insights about viewer behavior on your specific page. Wistia's platform is specifically designed for conversion-focused video — it provides heatmap data showing exactly which parts of a video viewers watch, skip, or re-watch, which is invaluable for optimizing video content over time.
Video by Industry: Which Categories See the Biggest Impact
IndustryConversion Rate ImpactMost Effective Video TypeSaaS / Software+55 – 80%Product demo, how-it-worksE-commerce (fashion/apparel)+80 – 105%Product in action, unboxingReal estate+45 – 70%Property walkthrough videosHealthcare / medical+35 – 55%Educational, doctor intro videosProfessional services+40 – 65%Team video, process explainerHome services (trades)+50 – 75%Before/after, testimonialsEducation+40 – 60%Course preview, instructor introFinancial services+30 – 50%Explainer, trust-building
Accessibility Considerations for Website Video
One dimension of website video that's frequently overlooked: accessibility. Video content that doesn't include captions is inaccessible to approximately 15% of the population with some degree of hearing impairment, and also to the large percentage of video viewers who watch with sound off (85% of Facebook video is watched silently; similar patterns apply to autoplay website video). Closed captions also provide a searchable text transcript that improves SEO — search engines can index the content of captioned video, expanding the keyword reach of the page.
The Bottom Line
Website video is one of the highest-ROI content investments available to businesses of virtually any type. The evidence is consistent across independent research: video increases conversion rates by 37–86% depending on placement, increases time-on-page by 2.6x, reduces bounce rate by 34%, and the 87% of consumers who've been influenced by video to make a purchase represents an almost universal consumer experience. For businesses that haven't yet added video to their key conversion pages, the opportunity is clear. For those who have video, optimizing length, placement, quality, and hosting choice based on the research benchmarks here can significantly improve already-strong results.
At Scalify, the websites we build are designed with video integration as a first-class consideration — with proper technical implementation, optimized placement, and page architecture that maximizes the impact of video content on both conversions and SEO.
Top 5 Sources
The compounding nature of consistent execution is the most important concept in digital marketing: individual tactics produce modest results; systematic implementation of multiple well-chosen tactics over 12–24 months produces transformative results. Identify the highest-impact improvements available to your specific situation, implement them with measurement infrastructure in place, and build the discipline to iterate based on what the data shows rather than intuition or industry trends that may not apply to your specific business and market.


.jpeg)

.jpeg)


78 SW 7th St, Miami, FL 33130


