


Average Website Conversion Rate by Industry (2026 Data)
By Josh Ternyak

April 20, 2026
Average conversion rates by industry from 0.5% to 20%. Comprehensive benchmarks by industry and traffic source, why rates differ from benchmarks, page type CVRs, micro-conversions, revenue per visitor, e-commerce quick wins, and how to calculate correctly.
Average Website Conversion Rate by Industry (2026 Data)
Conversion rate — the percentage of website visitors who complete a desired action — is one of the most important metrics in digital marketing, and one of the most misunderstood. The reason: there is no universal "good" conversion rate. A 2% conversion rate is excellent for an enterprise B2B SaaS product and catastrophic for a consumer e-commerce store selling $20 products. Understanding what benchmark is relevant to your specific business requires knowing your industry, your conversion type, your traffic sources, and your price point. This guide provides the industry-specific data that makes those comparisons meaningful.
Key Conversion Rate Statistics
Conversion Rate Benchmarks by Industry
IndustryAverage CVRTop 25%What "Conversion" MeansE-commerce (all products)1.5–2.5%4–6%Completed purchaseE-commerce (luxury/high-ticket)0.5–1.5%2–3%Completed purchaseSaaS / Software (free trial)2–5%7–12%Trial signupB2B Lead Generation2–5%6–10%Form submission / contact requestProfessional Services3–8%10–15%Consultation requestReal Estate2–4%5–8%Lead inquiryHealthcare / Medical3–6%8–12%Appointment bookingLegal Services4–8%10–15%Consultation requestFinancial Services5–10%12–20%Lead capture / account openTravel / Hospitality2–4%5–8%Booking or inquiryEducation / Courses1–3%4–7%Purchase or enrollmentNon-profit0.5–2%3–5%DonationLocal Service Business3–8%10–18%Phone call / contact form
Conversion Rate by Traffic Source
Traffic SourceAverage CVRWhyBranded organic search8–25%Visitor already knows and intends to find youEmail (existing subscribers)3–6%Pre-qualified, warm, established trustPaid search (branded)10–20%High intent + ad qualifies clickPaid search (non-branded)2–6%Good intent but evaluating optionsNon-branded organic search1.5–4%Research phase — not all ready to convertReferral (from relevant sources)3–8%Pre-endorsed by referring sourceSocial media (organic)0.5–2%Low purchase intent — browsing contextDisplay advertising0.3–1%Lowest intent — interruption advertising
Why Your Conversion Rate Differs From Benchmarks
Before optimizing toward a benchmark, understand why your rate may legitimately differ. The key variables that make benchmark comparisons unreliable without context:
Traffic quality. A site with 70% branded search traffic converting at 8% looks like a winner; the same site's non-branded pages converting at 1.2% are the real CRO opportunity. Aggregate conversion rate mixes high-quality branded traffic with lower-quality cold traffic — always analyze by traffic source before drawing conclusions about overall site performance.
What you're counting as a conversion. A "lead" that's an email signup for a newsletter is not the same commercial signal as a "lead" that's a detailed contact form submission requesting a consultation. Standardizing your conversion definition — and comparing against benchmarks using the same definition — is essential for valid comparisons.
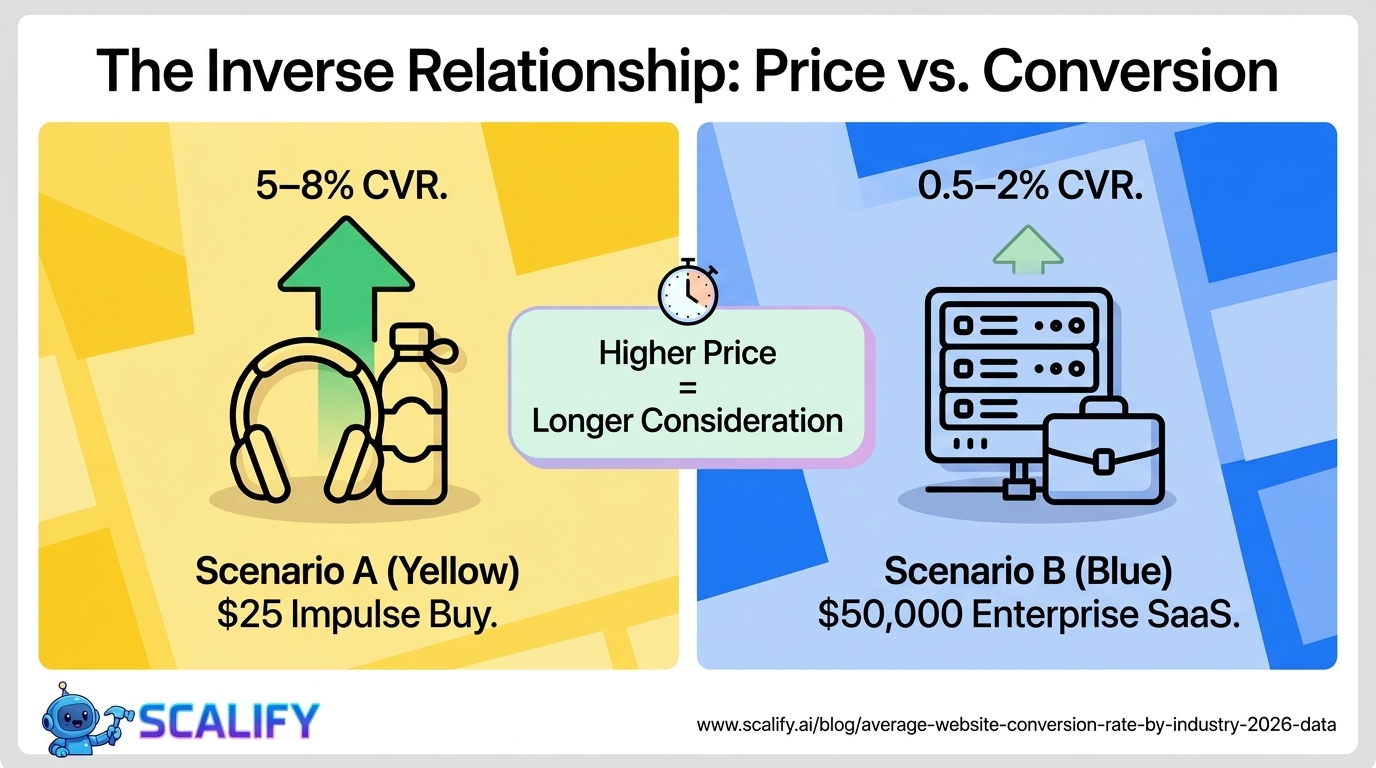
Price point. A $25 impulse purchase converts at 5–8%. A $5,000 professional service converts at 2–4%. A $50,000 enterprise software license converts at 0.5–2%. Higher price points require more consideration time and produce lower single-visit conversion rates regardless of website quality — this is a commercial reality, not a website performance problem.
Traffic volume. Conversion rates are more volatile at lower traffic volumes. A site with 200 monthly visits has a conversion rate that can swing 2–3% just from natural weekly variance. At 10,000 monthly visits, the true conversion rate is much more stable and reliable as a performance indicator.
The Highest-Impact Conversion Improvements
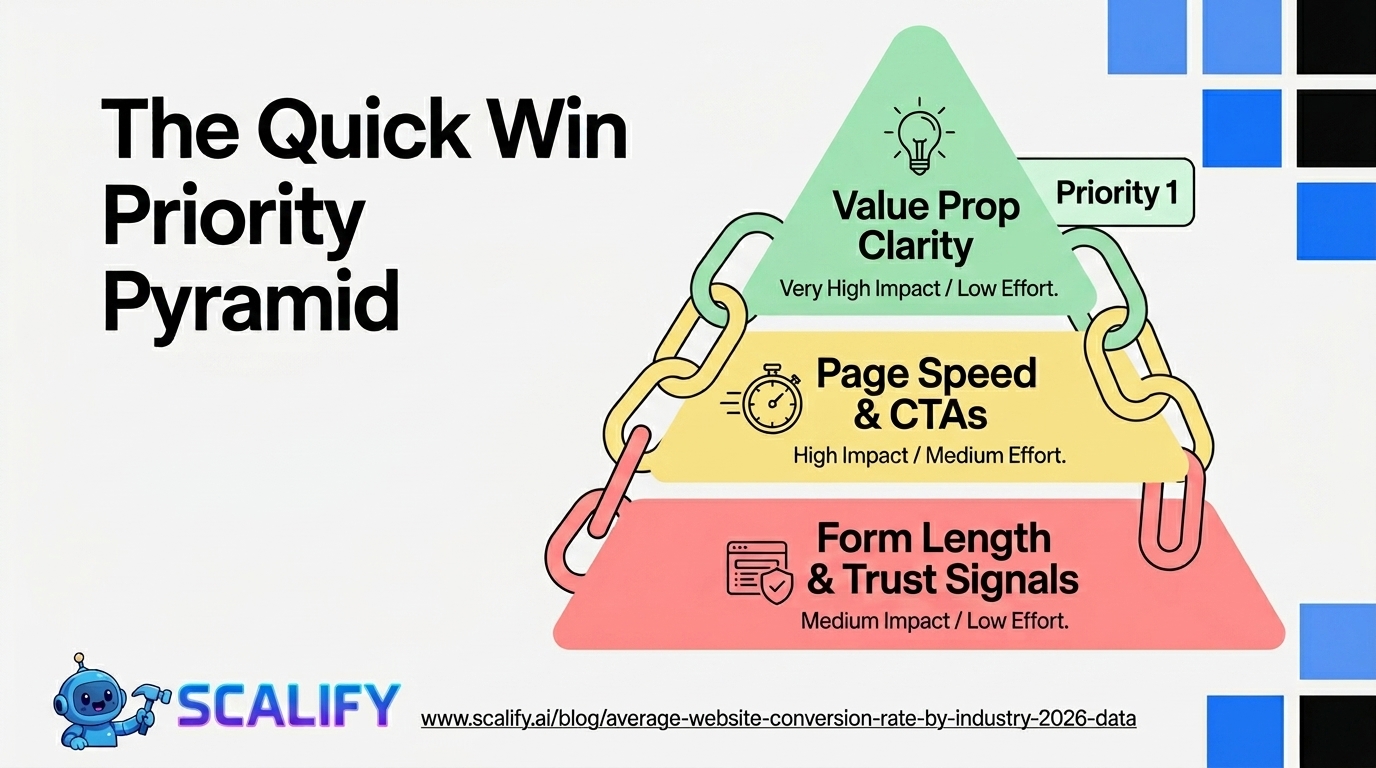
ImprovementAverage CVR ImpactEffort LevelPriorityValue proposition clarity (headline rewrite)Very High — often 2–3xLow1stPage load speed (Core Web Vitals)High — 7%/second savedMedium2ndCTA copy and prominenceHigh — up to 2xLow3rdSocial proof addition and placementHigh — +34% averageLow-Medium4thMobile experience optimizationHigh — 64% mobile gapMedium5thForm length reductionMedium-High — 20–120%Low6thTrust signals (payment, security)Medium — +7–18%Low7th
Setting Realistic Conversion Goals
Rather than targeting a benchmark, set goals based on your current rate and achievable improvement. A site currently converting at 1.2% has different targets than one at 3.8%. The most useful goal framework: identify the 2–3 highest-impact improvements your site needs (from the table above), estimate the improvement each would produce based on research data, and set a 90-day conversion goal that represents achieving the top 1–2 improvements. Review at 90 days with actual data and reset goals for the next quarter. This iterative approach produces more realistic expectations and more focused optimization effort than chasing an industry benchmark that may or may not be achievable for your specific site and traffic mix.
The Bottom Line
Average conversion rates range from 0.5% for non-profit donations to 20%+ for branded paid search. Industry benchmarks provide useful context but must be filtered through traffic source, price point, conversion type, and traffic volume before drawing conclusions about performance. The highest-impact improvements — value proposition clarity, page speed, CTA copy, social proof, and mobile experience — consistently move conversion rates above industry average regardless of starting point. Track your conversion rate by traffic source, set goals based on achievable improvements from your current baseline, and treat conversion rate optimization as a continuous discipline rather than a one-time project.
At Scalify, we build conversion-architectured websites — clear value propositions, prominent CTAs, well-placed social proof, and technical performance that ensures every visitor has the fastest possible path to conversion.
Top 5 Sources
Conversion Rate for Different Page Types
Conversion rates vary significantly by page type within the same website, and managing expectations at the page level prevents confusion about which pages are actually underperforming:
Page TypeTypical CVRKey Conversion DriverHomepage0.5–3%Multiple visitor types with different intentsPricing page5–15%High-intent visitors — evaluation stageProduct detail page1–4%Product appeal, price, social proofDedicated landing page4–15%Single CTA, matched to traffic sourceBlog post / article0.3–2%Top-of-funnel; email capture primary conversionContact/About page8–20%Visitors with explicit contact intentCheckout page65–70% completion of started checkoutFriction reduction, trust signals
The pricing page converts at 5–15% because it self-selects for visitors who are actively evaluating purchase — they've passed through awareness and consideration stages and are making a decision. Homepage conversion at 0.5–3% reflects the diversity of visitor intent — some ready to convert, most still researching. Comparing homepage conversion to pricing page conversion without acknowledging this self-selection difference produces misleading assessments of relative page performance.
Micro-Conversions: The Often-Overlooked Metric
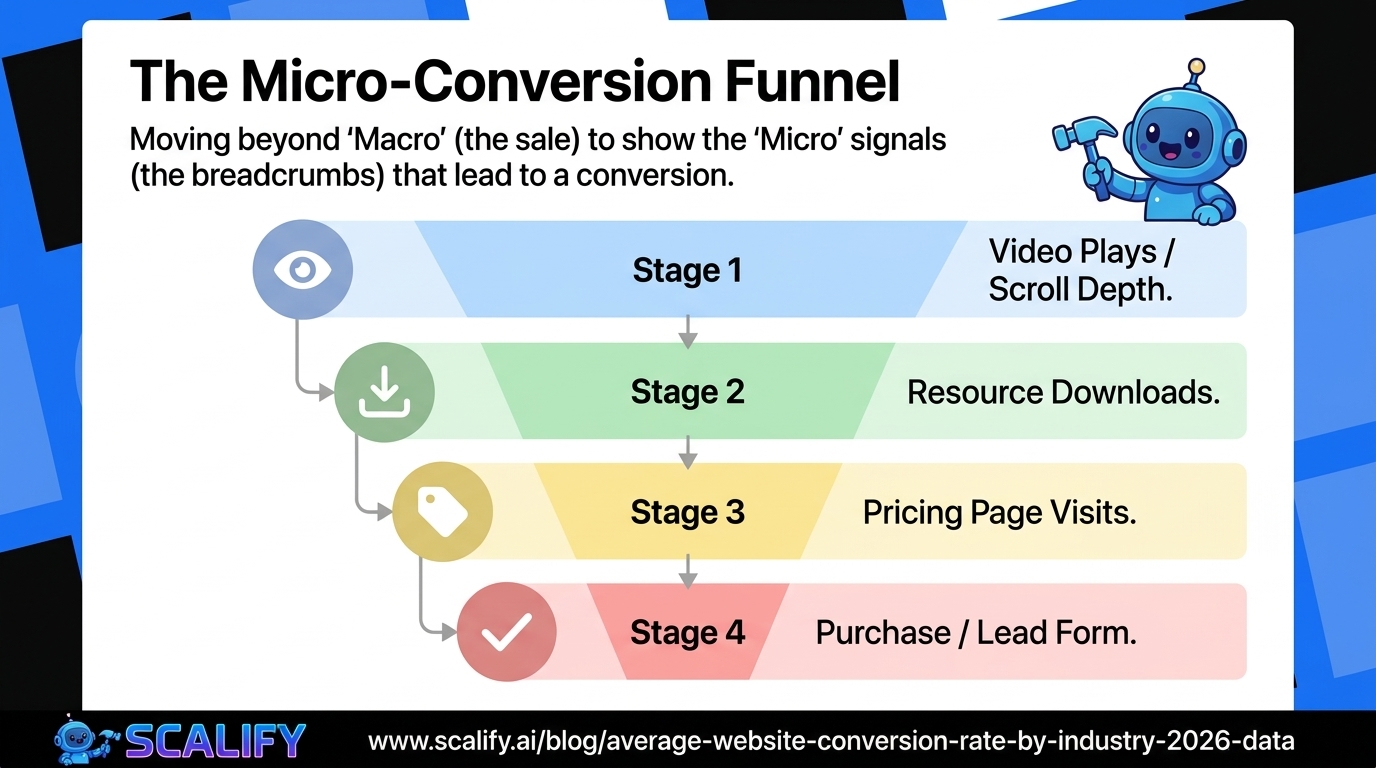
Macro-conversion tracking (purchases, form submissions, consultations booked) tells you what happened at the end of the funnel. Micro-conversion tracking tells you what's happening throughout the funnel — which is where you find the specific friction points preventing macro-conversions from happening more often.
High-value micro-conversions to track: email newsletter subscriptions (top-of-funnel lead capture), free resource downloads (content-to-lead conversion), video play rates on key pages (engagement with high-investment content), scroll depth on key landing pages (are visitors reading the value proposition?), add-to-cart rate separately from purchase rate (shows where checkout abandonment is occurring), pricing page visits from homepage (shows move from awareness to evaluation), and "Live Chat initiated" events (shows which pages generate questions). These micro-conversions tracked in GA4 produce a complete picture of the conversion funnel that macro-conversion rates alone obscure — and they identify intervention points far earlier in the process where optimization can prevent abandonment before the final conversion decision.
Conversion Rate vs. Revenue Per Visitor
Conversion rate alone is insufficient for evaluating commercial performance — a site with 5% conversion on a $25 product generates $1.25 per visitor, while a site with 1% conversion on a $1,000 product generates $10 per visitor. The more complete metric is Revenue Per Visitor (RPV) = Conversion Rate × Average Order Value. For lead generation sites, the equivalent is Leads Per Visitor × Average Lead Value. RPV allows comparison across very different business types and makes the business case for conversion optimization investments more concrete: a 30% improvement in CVR on a $10 RPV site adds $3 per visitor in revenue, which multiplied by monthly traffic produces the dollar value of the optimization investment.
Improving E-Commerce Conversion Rate: The Quick Wins
E-commerce sites with sub-2% conversion rates often have specific, addressable problems rather than fundamental market-fit issues. The highest-frequency quick wins that produce the largest conversion improvements:
Guest checkout option. Requiring account creation before checkout reduces checkout completion by 25–35%. Adding "checkout as guest" is the single highest-ROI e-commerce conversion fix available to sites that don't offer it. The psychology is simple: account creation feels permanent and scary; checkout feels temporary and safe.
Shipping cost transparency. Surprise shipping costs at checkout are the #1 cause of cart abandonment (Baymard: 48% of cart abandonments). Showing shipping cost (or "free shipping on orders over $X") on product pages rather than revealing it at checkout dramatically reduces abandonment from this cause.
Trust signals at checkout. SSL badge, accepted payment methods, and a clear return policy shown prominently at checkout reduce security-related abandonment. 17% of checkout abandonments are explicitly attributed to security concerns about entering payment information — visible trust signals address this directly without requiring any structural change to the checkout flow.
How to Calculate Your Conversion Rate Correctly
Basic conversion rate = (Conversions / Total Visitors) × 100. But the denominator and numerator each require careful definition to produce meaningful numbers. The denominator should be visitors who had the opportunity to convert — not all website visitors if only a subset ever see the page with the conversion mechanism. For a checkout conversion rate, use visitors who initiated checkout as the denominator, not all website visitors. For a contact form conversion rate, use visitors to the contact page, not total site visitors. This specificity turns a site-level aggregate (meaningless for optimization) into page-level and funnel-stage rates (actionable for optimization). GA4's Funnel Exploration tool enables this analysis natively — building a funnel from awareness page to conversion page shows exactly where visitors exit at each stage, providing the conversion rate for each step independently.
International Conversion Rate Variation
Conversion rates vary significantly by geographic market, driven by differences in consumer trust, payment infrastructure, and digital commerce maturity. US and UK markets typically have the highest e-commerce conversion rates for US/UK-focused stores; European markets (Germany, France) average lower conversion rates partly due to stronger consumer privacy attitudes; Asian markets (Japan, South Korea) have high conversion rates for mobile commerce but lower rates through desktop browsers. For businesses selling internationally, analyzing conversion rate by country and adjusting for local trust signals, payment methods, and cultural expectations produces larger conversion improvements than any site-wide optimization.
Conversion rate optimization is a continuous discipline that produces compounding returns when approached systematically. Start with the highest-impact, lowest-effort improvements — value proposition clarity and page load speed — then work down the priority list with data-backed A/B tests. The conversion rate improvements you achieve today make every subsequent marketing investment more productive, because the same traffic generates more revenue from a higher-converting website.
The most important takeaway from conversion rate benchmarks is not the number itself but the direction — whether your rate is improving or declining over time and whether specific changes you make are producing measurable conversion improvements. A site with a 2% conversion rate that was 1.5% six months ago is performing excellently; a site with a 3% rate that was 4.5% six months ago has a problem to investigate. Trend analysis of your conversion rate over rolling 30 and 90 day periods, segmented by traffic source and device type, provides more actionable insight than any industry benchmark comparison.


.jpeg)

.jpeg)


78 SW 7th St, Miami, FL 33130


