


Website ROI Statistics: How Much Does a Website Make? (2026 Data)
By Josh Ternyak

April 17, 2026
Comprehensive guide: Website ROI Statistics: How Much Does a Website Make? (2026 Data)
Key Statistics: Website ROI and Revenue Generation
The Website ROI Calculation: How to Think About Return
Calculating website ROI requires a clear-eyed look at both sides of the equation: what the website costs (total investment including build, hosting, maintenance, and marketing) and what it produces (direct revenue from web-generated leads and sales, plus the harder-to-quantify effects on conversion rate for offline channels the web influenced).
The challenge in measuring website ROI is attribution complexity. A customer who found your business on Google, visited your website, didn't convert, saw your Facebook ad, came back to your website, and then called your office to book a service — how much of that revenue credit belongs to the website? Multi-touch attribution models attempt to answer this, but most businesses don't have the analytics infrastructure to measure it. The most practical approach for most businesses is to measure the web channel's direct contribution (form submissions, online purchases, phone calls tracked from website visits) while acknowledging that the website also influences conversions in channels that are harder to track directly.
Website Investment Levels and Typical ROI Ranges
Investment LevelAnnual Total CostRevenue Generated (Avg)ROI RangeTypical ForDIY Website (Wix/Squarespace)$200 – $600/yr$2,000 – $15,000300–1,500%Very small businesses, solopreneursTemplate/Agency Website$2,000 – $8,000 build + $500–$1,200/yr maintenance$15,000 – $85,000200–800%Small-to-mid service businessesProfessional Custom Website$8,000 – $25,000 build + $1,200–$3,600/yr$80,000 – $500,000+300–2,000%Established businesses, professional servicesEnterprise Web Presence$50,000–$500,000+ annually (build + ongoing)$1M – $100M+Variable (typically 500%+)Large companies, e-commerce at scale
These ROI ranges have wide variance because website revenue depends heavily on traffic volume (driven by SEO, advertising, social media, and direct), conversion rate optimization, and the average value per conversion in the specific business. A beautifully designed website with no SEO investment and no traffic generates zero revenue. A mediocre website ranking #1 for high-intent search terms generates significant revenue. The ROI calculation must include both the website cost and the marketing investment that drives traffic to it.
ROI by Business Type: Detailed Analysis
Local Service Business Website ROI
For HVAC companies, plumbers, electricians, landscapers, and similar home service businesses, the website ROI calculation is among the most direct and compelling in any business category. These businesses operate in markets where customers have urgent needs, limited loyalty to existing providers, and strong intent to call the first credible result they find:
MetricExample HVAC CompanyMonthly website visitors (after SEO)1,200Phone call conversion rate from website4.5%Monthly calls generated54Calls that book service65% = 35 jobsAverage ticket value$350Monthly revenue from website channel$12,250Annual revenue from website$147,000Annual website cost (custom build amortized + hosting + SEO)$8,400/yrAnnual ROI1,650%
The numbers in this example reflect achievable outcomes for local service businesses with properly optimized websites and local SEO. The key variable is organic search ranking — a website not appearing in Google's local pack or top organic results for "HVAC repair [city name]" generates near-zero traffic regardless of quality, while a website ranking in positions 1–3 generates consistent high-intent phone calls.
Professional Services Website ROI
For law firms, accounting firms, and consulting firms, the website ROI calculation is driven by the very high value of each client acquired through the web channel:
MetricExample Personal Injury Law FirmMonthly website visitors3,500Consultation form conversion rate2.2%Monthly consultation requests77Qualified cases accepted15% = 11.5 casesAverage case value (settlement fees)$22,000Monthly revenue from website$253,000Annual revenue from website channel$3.04 millionAnnual investment (build + SEO + content)$48,000Annual ROI6,233%
These numbers reflect outcomes for a law firm with active investment in legal SEO and content marketing — which is not unusual for competitive personal injury markets. The math explains why legal is one of the most competitive SEO verticals: the revenue per client is so high that enormous marketing investments are justified.
E-Commerce Website ROI
E-commerce ROI varies enormously based on product margins, average order value, customer lifetime value, and traffic acquisition costs:
MetricExample DTC Health Products StoreMonthly website visitors25,000Conversion rate2.4%Monthly orders600Average order value$85Monthly gross revenue$51,000Gross margin60%Monthly gross profit$30,600Monthly web infrastructure cost (platform + hosting + dev)$2,800ROI on web infrastructure alone993%
E-commerce ROI must be calculated on gross profit, not revenue — the cost of goods sold makes revenue-based ROI misleading. For high-margin digital products, software, or subscription businesses, the ROI is dramatically higher. For low-margin commodity products, the math is tighter and web infrastructure cost efficiency matters more.
The Content Marketing ROI Case
Content marketing — creating blog posts, guides, case studies, and other content that ranks in search engines and drives organic traffic — produces some of the highest website ROI measurements available, but the timeline is longer (6–18 months to see returns) and the measurement is more complex:
MetricSaaS Company with Content StrategyMonthly organic blog traffic (18 months in)45,000Blog-to-trial conversion rate1.8%Monthly trial signups from content810Trial-to-paid conversion rate22%Monthly new paying customers from content178Average monthly recurring revenue per customer$89Monthly new MRR from content channel$15,842Annual content investment (writers + SEO tools)$120,000Annual return (first-year value only)$190,104First-year content ROI58% (growing with LTV)
The content ROI looks modest in year 1 but compounds significantly in years 2–3 as content continues ranking and generating traffic without proportional additional investment. A piece of content that took $500 to create and continues generating 1,000 organic visitors per month for 3 years has a cost-per-visit of approximately $0.014 by year 3 — making it one of the most cost-efficient traffic sources available.
Why Website ROI Varies So Widely: The Key Variables
Understanding what drives website ROI variation is more practically valuable than any single average figure:
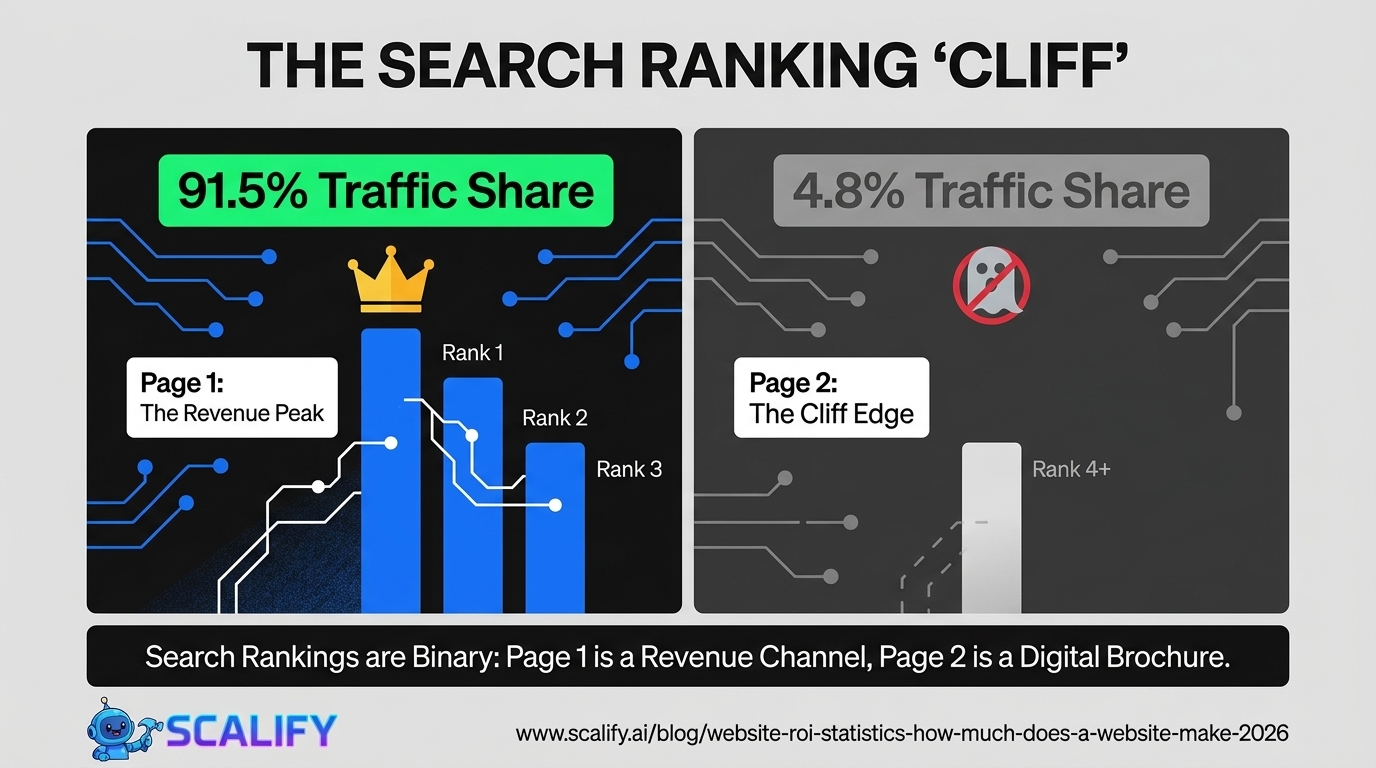
Search Rankings Are Binary
Google's research shows that page 1 results receive 91.5% of search traffic, and page 2 receives 4.8%. The difference between ranking on page 1 and page 2 for a high-volume commercial query isn't "somewhat more traffic" — it's categorically different revenue potential. Websites that rank in positions 1–3 for relevant searches receive orders of magnitude more traffic than those ranking in positions 8–10 or page 2, which means the ranking distribution of traffic is extremely skewed. This winner-take-most dynamic means that the difference between a website with active SEO investment and one without often isn't incremental — it's the difference between a primary revenue channel and an inactive digital brochure.
Conversion Rate Optimization
Two identical websites receiving the same traffic can generate dramatically different revenue if their conversion rates differ. A website converting at 1% vs 3% generates 3x the revenue from the same traffic. The interventions that move conversion rates — faster load times, clearer CTAs, better social proof, simplified checkout flows, mobile optimization — are often relatively low-cost compared to the revenue impact they produce, making CRO one of the highest-ROI investments in the web ecosystem.
Average Customer Value
A personal injury law firm and a restaurant both have websites, but the value of a single new customer is $22,000 vs $40 respectively. The restaurant must therefore generate 550 times more customer conversions to produce the same revenue from web investment. This explains why high-value professional services see extraordinary website ROI while commodity businesses see modest absolute returns even with strong conversion rates.
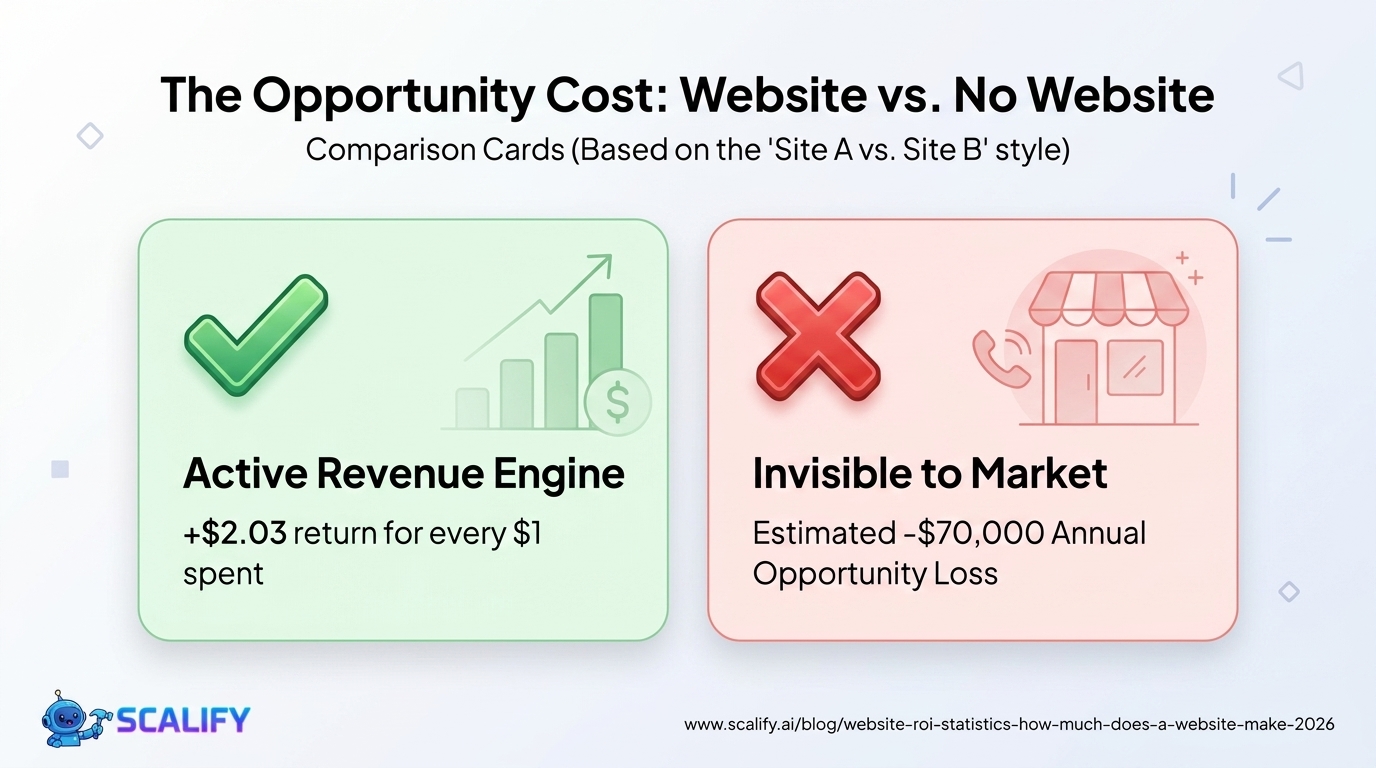
The Cost of Not Having a Professional Website
The Verisign/NFIB research finding that businesses without websites lose approximately $70,000 annually in potential revenue represents the opportunity cost of non-investment — and the floor of what a professional website should be expected to generate to justify its existence. More granular estimates by business type:
Business TypeEst. Annual Revenue Loss Without WebsiteLocal service business (HVAC, plumbing)$45,000 – $180,000Professional services (law, accounting)$80,000 – $500,000+Restaurant (without online ordering)$25,000 – $80,000Retail (without e-commerce)$35,000 – $200,000+Healthcare practice$50,000 – $150,000B2B services company$100,000 – $1,000,000+
What "Website ROI" Looks Like Month by Month
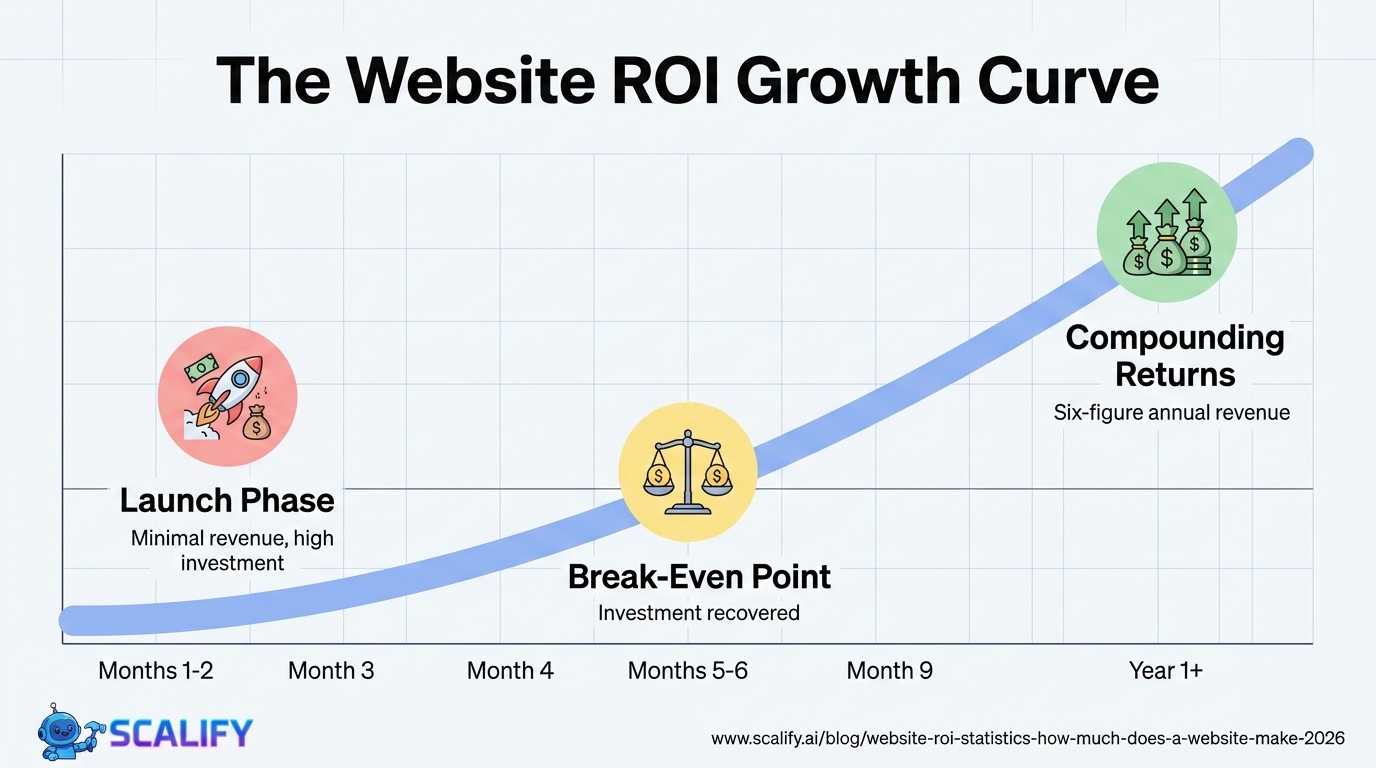
For a typical small service business investing in a professional website with active SEO, the revenue curve typically looks like this:
MonthMonthly Revenue from Web ChannelCumulative RevenueInvestment Recovered?Month 1–2$200 – $800$200 – $1,600No (site just launched, minimal ranking)Month 3–4$800 – $2,500$2,400 – $6,600Partial (early search rankings developing)Month 5–6$2,500 – $5,000$9,400 – $18,600Yes for most investment levelsMonth 7–12$4,000 – $10,000/mo$37,400 – $88,600Compounding returnsYear 2+$8,000 – $20,000/moSix figures annuallyMature channel performance
The 5–6 month timeframe for investment recovery is the median for professional websites with active SEO work. The range is wide — businesses in highly competitive markets (many competitors also doing SEO) take longer; businesses in underserved niches can see returns in month 2 or 3 when there's minimal competition for relevant search terms.
The Bottom Line
Website ROI ranges from 200%–6,000%+ depending on business type, investment level, search optimization, and conversion rate. The consistent research finding is $2.03 returned for every $1 invested at the small business average — and dramatically higher returns for businesses in high-value service categories that invest in both professional web presence and search visibility. The most critical insight: a website without traffic generates near-zero ROI. The investment in driving qualified traffic (organic search through SEO, paid search through PPC, social media) is as important as the website itself — the two together constitute the web channel that generates measurable returns.
At Scalify, we build professional websites in 10 business days that are engineered to generate returns — built for search visibility, optimized for conversion, and designed to make your web presence your highest-ROI marketing channel.
Top 5 Sources
The compounding nature of consistent execution is the most important concept in digital marketing: individual tactics produce modest results; systematic implementation of multiple well-chosen tactics over 12–24 months produces transformative results. Identify the highest-impact improvements available to your specific situation, implement them with measurement infrastructure in place, and build the discipline to iterate based on what the data shows rather than intuition or industry trends that may not apply to your specific business and market.


.jpeg)

.jpeg)


78 SW 7th St, Miami, FL 33130


