


Average Website Loading Speed Statistics 2026: Complete Data Guide
By Josh Ternyak

April 17, 2026
Website loading speed directly impacts revenue, bounce rate, and search rankings. This comprehensive data guide covers average page load times across industries, devices, and connection types — with research-backed statistics on exactly how speed affects conversions and SEO.
Key Statistics: Website Loading Speed 2026
Understanding Website Speed Metrics: What We're Actually Measuring
Before diving into benchmarks and statistics, it's worth clarifying what "website loading speed" actually means in technical terms — because the answer has grown significantly more complex over the past decade. There isn't a single number that defines website speed; there are multiple metrics that measure different aspects of the user experience timeline, each with distinct implications for both user perception and search engine optimization.
The shift from simple "page load time" to Google's Core Web Vitals framework represents the most significant change in how the industry measures and talks about speed. Understanding the distinction between these metrics is essential context for interpreting the statistics in this guide.
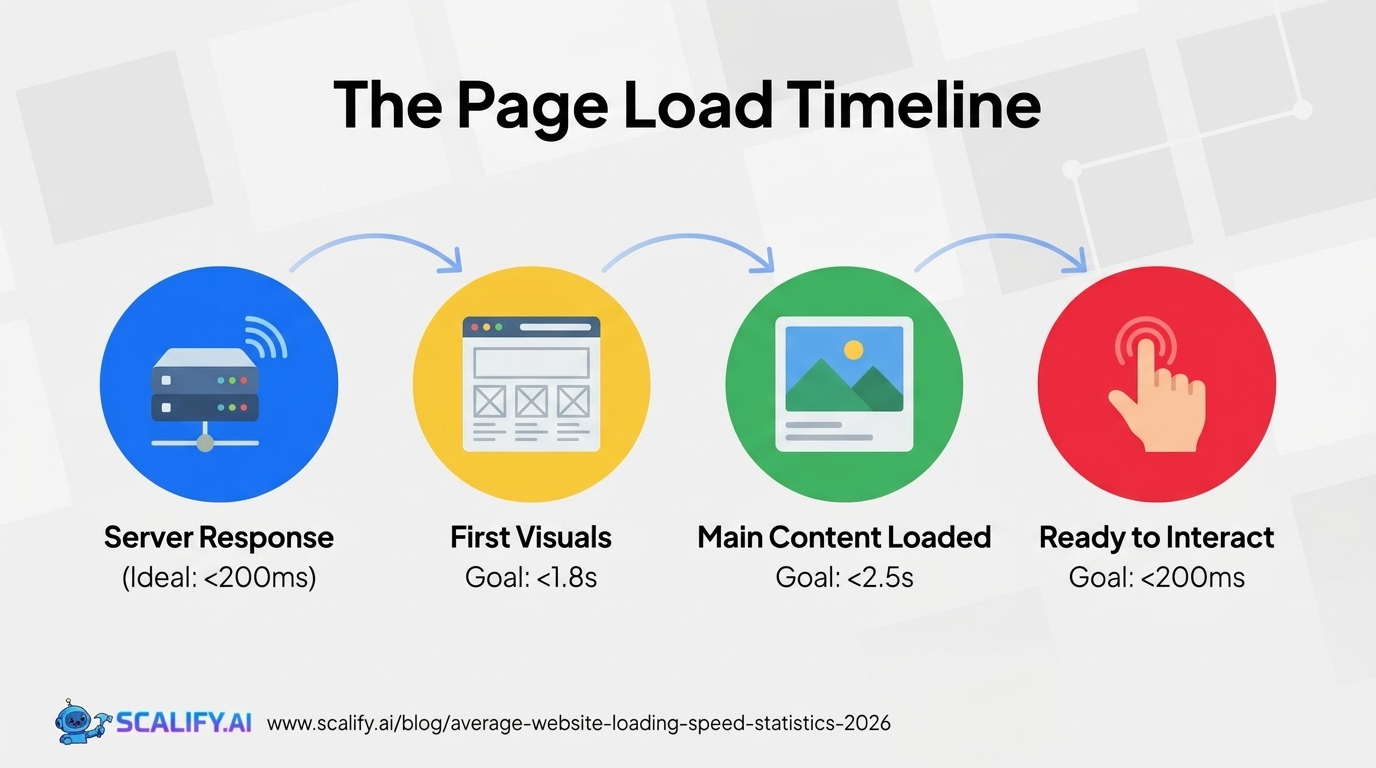
Time to First Byte (TTFB)
TTFB measures how long it takes for a browser to receive the first byte of page content from the server after making a request. It's a server-side metric that reflects server processing time, network latency, and CDN effectiveness. A fast TTFB (under 200ms) is table stakes — it doesn't make a site feel fast on its own, but a slow TTFB (over 600ms) makes everything else worse because all subsequent loading is delayed.
Google's recommendation for TTFB is under 800ms for a "good" experience, with under 200ms being optimal. The average TTFB across the web is approximately 620ms — meaning the typical website is running at the very edge of "good" on this metric alone before the browser has even started rendering anything.
First Contentful Paint (FCP)
FCP measures how long it takes for the first piece of DOM content to appear on screen — text, an image, a background image, or a non-white canvas element. It's the moment users first see something happening, which is crucial for perceived performance even if the page isn't fully loaded. Google considers FCP under 1.8 seconds "good," 1.8–3.0 seconds "needs improvement," and over 3.0 seconds "poor."
Largest Contentful Paint (LCP) — The Most Important Core Web Vital
LCP measures when the largest content element above the fold finishes loading and rendering. It's typically a hero image, a large block of text, or a video thumbnail — the visually dominant element that signals to the user that the main content has arrived. Google considers LCP under 2.5 seconds "good," 2.5–4.0 seconds "needs improvement," and over 4.0 seconds "poor."
LCP is the Core Web Vital most directly correlated with user satisfaction and search ranking. It's also one of the most frequently failed — the majority of websites on the web do not achieve an LCP under 2.5 seconds on mobile connections, which is why Google's Core Web Vitals pass rate is only 33%.
First Input Delay (FID) / Interaction to Next Paint (INP)
FID (and its replacement, INP, which became a Core Web Vital in March 2024) measures responsiveness — how quickly the page responds to user interactions like clicks, taps, and key presses. A page can look loaded but still feel slow if clicking a button doesn't register for 500+ milliseconds because JavaScript is blocking the main thread. Google considers INP under 200ms "good" and over 500ms "poor."
Cumulative Layout Shift (CLS)
CLS measures visual stability — how much the page content jumps around during loading. A CLS score above 0.1 means content is moving in disruptive ways as images load, ads inject, or fonts swap. This is the metric responsible for the experience of clicking a link and having it shift under your cursor as the page finishes loading. Google considers CLS under 0.1 "good" and above 0.25 "poor."
Average Page Load Times by Connection Type
Connection TypeAvg Page Load Time% of Global TrafficPrimary Region5G Mobile1.2 – 2.1 seconds~18%US, South Korea, Japan, Europe4G LTE Mobile3.4 – 5.8 seconds~52%Global3G Mobile8.2 – 14.5 seconds~16%Developing marketsWired Broadband (Desktop)1.8 – 3.2 seconds~12%Primarily developed marketsFiber Broadband (Desktop)0.9 – 1.8 seconds~2%Urban areas, developed markets
The dominance of 4G LTE as the primary global connection type explains why mobile page load times are so much worse than desktop — 4G connections are inherently higher-latency than wired connections, particularly in suburban and rural areas where signal strength varies. The 5G rollout is improving this trajectory, but 5G availability remains concentrated in dense urban areas and will take years to become the dominant mobile connection type globally.
The 3G traffic share — still approximately 16% of global web traffic — represents an important design consideration often overlooked by developers in high-income markets. A page that loads "fast" at 3 seconds on 4G takes over 8 seconds on 3G, pushing it into the abandonment zone for a substantial portion of the world's internet users. For companies with global audiences, 3G performance optimization isn't a niche concern — it's mainstream audience optimization.
Average Page Load Time by Industry
IndustryDesktop Avg Load TimeMobile Avg Load TimeLCP Score (% "Good")Technology / SaaS2.8s4.2s48%Finance & Banking3.0s4.8s42%Healthcare3.2s5.1s39%News & Media3.5s5.8s34%Real Estate3.8s6.1s31%Travel & Hospitality4.2s6.5s28%E-Commerce4.5s6.8s25%Retail (Brick-and-Mortar with site)4.8s6.9s22%Government5.0s7.5s19%Food & Restaurant4.6s7.1s23%
The technology sector's relative speed advantage isn't a coincidence — tech companies are more likely to have dedicated engineers who understand web performance, more likely to use modern front-end architectures optimized for speed, and more likely to be using best-in-class CDN infrastructure. The retail and restaurant industries — which often use older CMS systems loaded with plugins, large unoptimized images, and third-party tracking scripts — consistently show the worst performance metrics.
The e-commerce speed problem is particularly significant given the direct connection between speed and revenue in that sector. An industry averaging 4.5 seconds desktop load time and 6.8 seconds mobile load time is, on average, leaving substantial conversion revenue on the table through poor performance.
Core Web Vitals Pass Rates: The Real State of Web Performance
Core Web Vital% Passing on Desktop% Passing on MobileThreshold for "Good"Largest Contentful Paint (LCP)62%42%Under 2.5 secondsInteraction to Next Paint (INP)83%68%Under 200msCumulative Layout Shift (CLS)74%65%Under 0.1All Three Combined ("Pass")51%33%All three "good"
The combined pass rate of 33% on mobile — meaning two-thirds of all websites on the internet fail Google's Core Web Vitals standards on mobile — represents one of the most striking indictments of the state of web performance. Google has been pushing Core Web Vitals as a search ranking signal since May 2021, which means businesses with failing scores are potentially losing organic search visibility to competitors who have optimized.
LCP is the most frequently failed metric on both desktop and mobile, because optimizing LCP requires addressing the largest image or content element on the page — typically a hero image that wasn't properly sized, compressed, given lazy loading priority, or served in a next-generation format. These are addressable problems, but they require deliberate engineering attention that many websites haven't received.
Speed vs Conversion Rate: The Business Case in Numbers
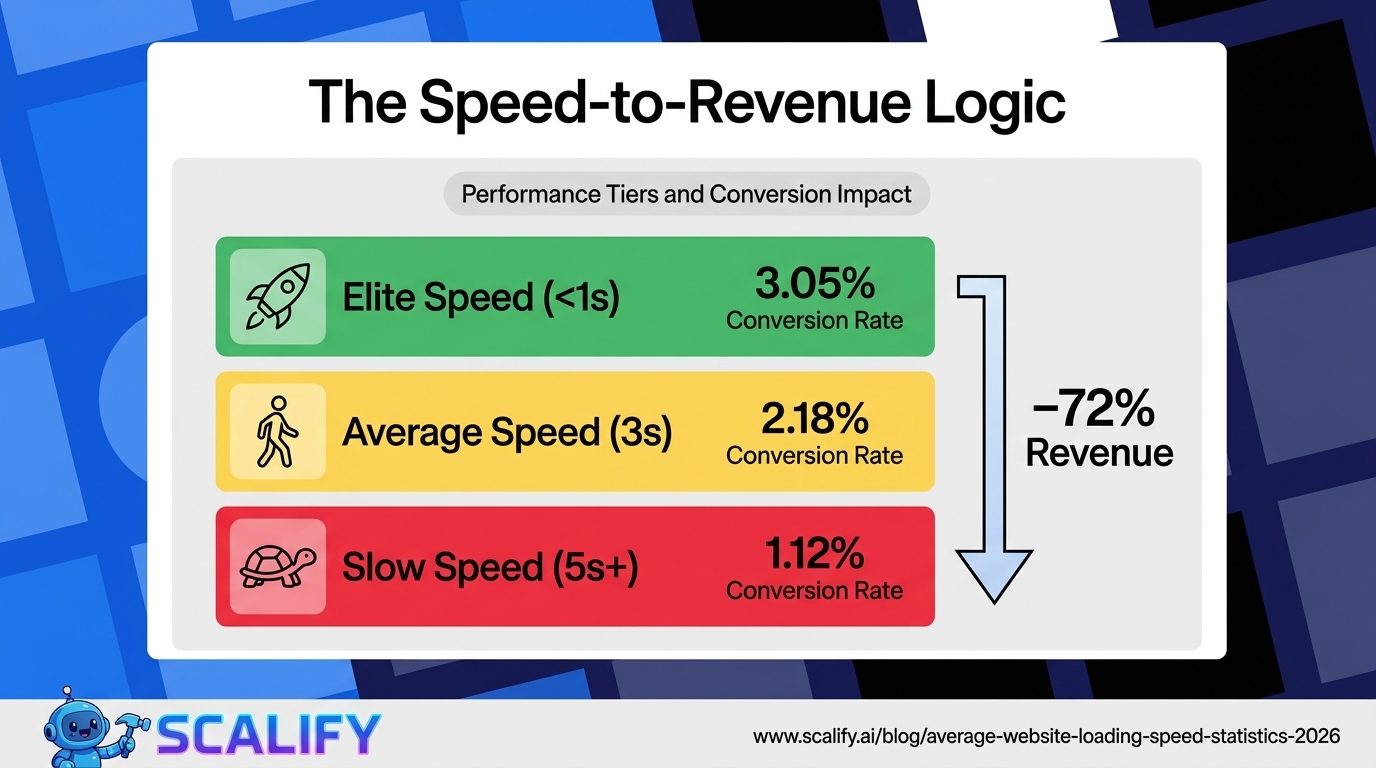
Load TimeApproximate Conversion Ratevs 1-Second BaselineUnder 1 second~3.05%Baseline (best performance)1–2 seconds~2.63%-14%2–3 seconds~2.18%-29%3–4 seconds~1.74%-43%4–5 seconds~1.34%-56%5–6 seconds~1.12%-63%Over 6 seconds~0.86%-72%
Source: Portent research across 24 million page views. These numbers represent one of the strongest quantitative arguments for web performance investment in existence. A 4-second page that converts at 1.74% compared to a 1-second page at 3.05% represents a 75% difference in business outcomes from the same traffic. In practical terms, if your 4-second website receives 10,000 monthly visitors, optimizing to sub-1-second load time could increase conversions from 174 to 305 per month — a gain of 131 conversions monthly without changing your marketing spend.
Mobile Abandonment Rate by Load Time
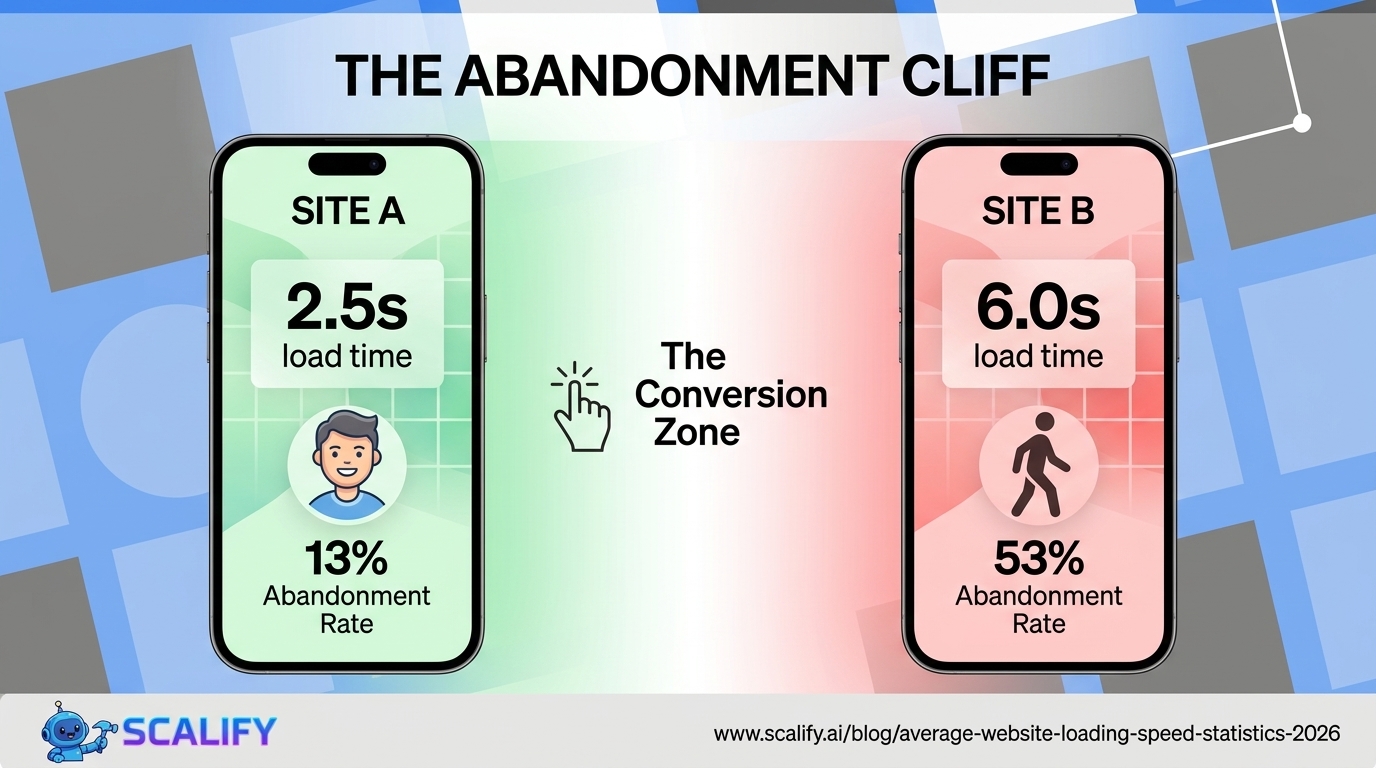
Load Time (Mobile)Probability of Abandonment% of Traffic Lost1–2 seconds9%Minimal loss2–3 seconds13%Baseline acceptable3–5 seconds32%Significant loss begins5–7 seconds53%Majority of users leave7–10 seconds65%Severe traffic lossOver 10 seconds79%Catastrophic abandonment
The Google data underlying these abandonment rates is some of the most consequential research in web development. The jump from 13% abandonment at 2–3 seconds to 53% abandonment at 5–7 seconds represents a 4x increase in traffic loss for a relatively small increase in load time. For websites with significant mobile traffic — which is now the majority of web traffic — this means that a page loading in 6 seconds instead of 2.5 seconds is losing over half its mobile visitors before they see any content.
Speed's Impact on Bounce Rate
Page Load TimeAverage Bounce RateChange vs 1-Second Baseline1 second7%Baseline2 seconds9%+28.5%3 seconds22%+214%4 seconds29%+314%5 seconds34%+385%8 seconds48%+586%10 seconds58%+728%
The bounce rate curve shows a particularly sharp inflection between 2 and 3 seconds — bounce rate more than doubles (from 9% to 22%) for just one additional second of load time. This threshold effect has significant implications for optimization prioritization: getting from 5 seconds to 3 seconds is less impactful than getting from 3 seconds to 2 seconds. The first two seconds are where the compounding returns on optimization are largest.
How Page Weight Affects Speed
YearAverage Page Weight (Desktop)Average Page Weight (Mobile)2012~720 KB~320 KB2015~1.4 MB~680 KB2018~1.87 MB~1.58 MB2020~2.05 MB~1.87 MB2022~2.26 MB~2.05 MB2024~2.38 MB~2.18 MB2026 (est.)~2.45 MB~2.24 MB
Average page weight has grown approximately 240% since 2012 — driven primarily by images, JavaScript bundles, third-party scripts, and web fonts. The mobile page weight figure is now approximately 90% of the desktop figure, which means most websites are not properly serving reduced-weight assets to mobile devices despite mobile's connection and CPU constraints. HTTP Archive data shows that the average webpage includes 70+ HTTP requests, 26+ third-party scripts, and dozens of images — all of which contribute to the load time problem.
The most impactful contributors to page weight by category:
Asset TypeAverage Contribution to Page WeightOptimization PotentialImages~48% (1.17 MB)Very high — modern formats, lazy loadingJavaScript~27% (650 KB)High — code splitting, tree shakingFonts~9% (220 KB)Moderate — subset, font-display: swapCSS~6% (145 KB)Moderate — purge unused, minifyHTML~3% (72 KB)LowOther (video, audio, misc)~7%Variable
Speed by Website Platform/CMS
PlatformAvg Mobile LCPCore Web Vitals Pass RateNotesCustom-built (optimized)1.8s68%Best possible outcome with proper engineeringNext.js / Vercel2.1s61%Strong defaults, CDN deliveryWebflow2.8s52%Good foundation, image optimization mattersShopify (optimized theme)3.2s44%Varies heavily by theme and appsSquarespace3.8s37%Limited optimization controlWordPress (optimized)3.4s41%Caching + CDN can achieve good scoresWordPress (unoptimized)6.8s12%Plugin bloat, no caching, shared hostingWix5.2s22%Improving but historically poor performance
The WordPress performance spread is particularly dramatic — optimized WordPress sites can achieve genuinely fast LCP scores, but the average WordPress site without performance optimization (no caching plugin, no CDN, uncompressed images, plugin-heavy setup on shared hosting) is one of the slowest platforms on the web. This explains why WordPress has a reputation for slow sites despite the platform itself being capable of excellent performance with proper engineering.
Speed and SEO: Google's Ranking Signal
Google has made page experience — including Core Web Vitals — an official search ranking signal since May 2021. The practical impact on rankings is still debated in the SEO community, but the available data supports several conclusions:
The relationship between speed and SEO rankings is bidirectional: fast sites rank better, and better rankings bring more traffic to sites that can then benefit from speed's conversion rate advantages. This compounding effect makes performance investment doubly valuable compared to other CRO or SEO activities.
The Revenue Impact of Speed: Real-World Case Studies
Abstract statistics become more concrete when examined through documented case studies of how speed improvements affected specific businesses:
How to Measure Your Website's Speed
The primary tools for measuring website speed performance, all free:
The Bottom Line
The average website loads in 3.21 seconds on desktop and 8.6 seconds on mobile — well above the 2.5-second LCP threshold Google considers "good," and in the range where 53% of mobile users abandon before seeing content. Only 33% of websites pass all Core Web Vitals metrics on mobile. The business impact is directly measurable: each additional second of load time reduces conversions by approximately 7%, pages loading in under 1 second convert at nearly 3x the rate of 5-second pages, and the correlation between Core Web Vitals scores and Google rankings is consistent across industry analyses. Web performance isn't a technical concern that only engineers care about — it's a direct driver of traffic, conversion, and revenue.
At Scalify, every website we build is engineered for Core Web Vitals performance — optimized images, proper lazy loading, clean code without plugin bloat, and CDN delivery that produces fast, conversion-ready experiences from day one.
Top 5 Sources


.jpeg)

.jpeg)


78 SW 7th St, Miami, FL 33130


