


Website Uptime Statistics: What Downtime Actually Costs (2026)
By Josh Ternyak

April 17, 2026
Comprehensive guide: Website Uptime Statistics: What Downtime Actually Costs (2026)
Key Statistics: Website Uptime and Downtime
Understanding Uptime: What the Percentages Actually Mean
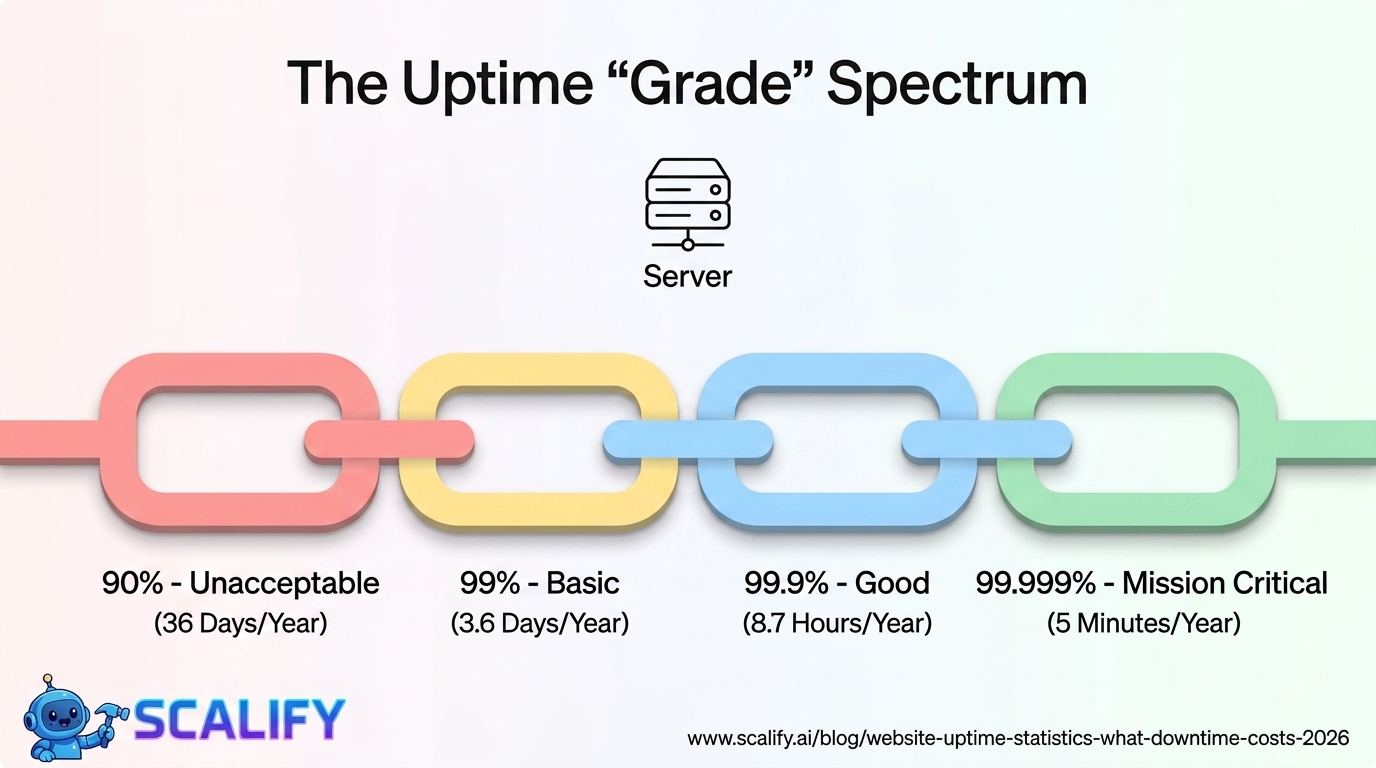
Uptime percentages look like small differences on paper. The gap between 99% and 99.9% is only 0.9 percentage points. But translated into actual downtime, the difference is enormous — and for a business website, it represents the difference between negligible risk and significant operational exposure.
Uptime %Downtime Per YearDowntime Per MonthDowntime Per WeekGrade90%36.5 days72 hours16.8 hoursUnacceptable95%18.25 days36 hours8.4 hoursPoor99%3.65 days (87.6 hrs)7.2 hours1.68 hoursBasic99.5%1.83 days (43.8 hrs)3.6 hours50.4 minutesAcceptable99.9%8.76 hours43.8 minutes10.1 minutesGood99.95%4.38 hours21.9 minutes5 minutesVery Good99.99%52.6 minutes4.4 minutes1 minuteExcellent99.999%5.26 minutes26.3 seconds6 secondsMission Critical
The practical meaning of these numbers varies by business type. For a blog or informational website with modest traffic, 99% uptime (87.6 hours of downtime per year) may be perfectly acceptable — the downtime is distributed through the year, mostly during low-traffic hours, and represents minimal revenue loss. For an e-commerce store doing $1 million in annual revenue, those 87.6 hours of downtime represent approximately $10,000 in direct lost revenue at average conversion rates, plus SEO damage, brand damage, and customer trust erosion that compounds over time.
Average Uptime by Hosting Type
Hosting TypeTypical Uptime SLAActual Average UptimeCost RangeShared Hosting (budget)99% – 99.5%~98.5%$3 – $10/moShared Hosting (quality)99.9%~99.3%$5 – $20/moVPS (Virtual Private Server)99.9%~99.6%$20 – $100/moManaged WordPress Hosting99.9% – 99.95%~99.7%$25 – $200/moCloud Hosting (AWS/GCP/Azure)99.95% – 99.99%~99.9%$50 – $500+/moDedicated Server99.9% – 99.99%~99.8%$100 – $500/moEnterprise / Multi-Region CDN99.99%+~99.99%$500 – $5,000+/mo
The gap between the SLA (Service Level Agreement — what hosting companies promise) and actual average uptime is an important distinction. Budget shared hosting providers routinely advertise "99.9% uptime" while independent monitoring services consistently record actual uptimes of 98–99% on budget plans. This gap exists because SLAs typically exclude planned maintenance windows, DDoS mitigation downtime, and short outages below a threshold duration.
Independent hosting uptime monitoring companies like UptimeRobot, Pingdom, and StatusCake provide more accurate performance data than hosting company marketing materials. Their research consistently shows that managed WordPress hosting (WP Engine, Kinsta, Flywheel) and quality cloud hosting deliver materially better real-world uptime than budget shared hosting, often at a cost differential of $20–$50/month — an investment that pays back quickly for any business-critical website.
The Financial Cost of Downtime by Business Type
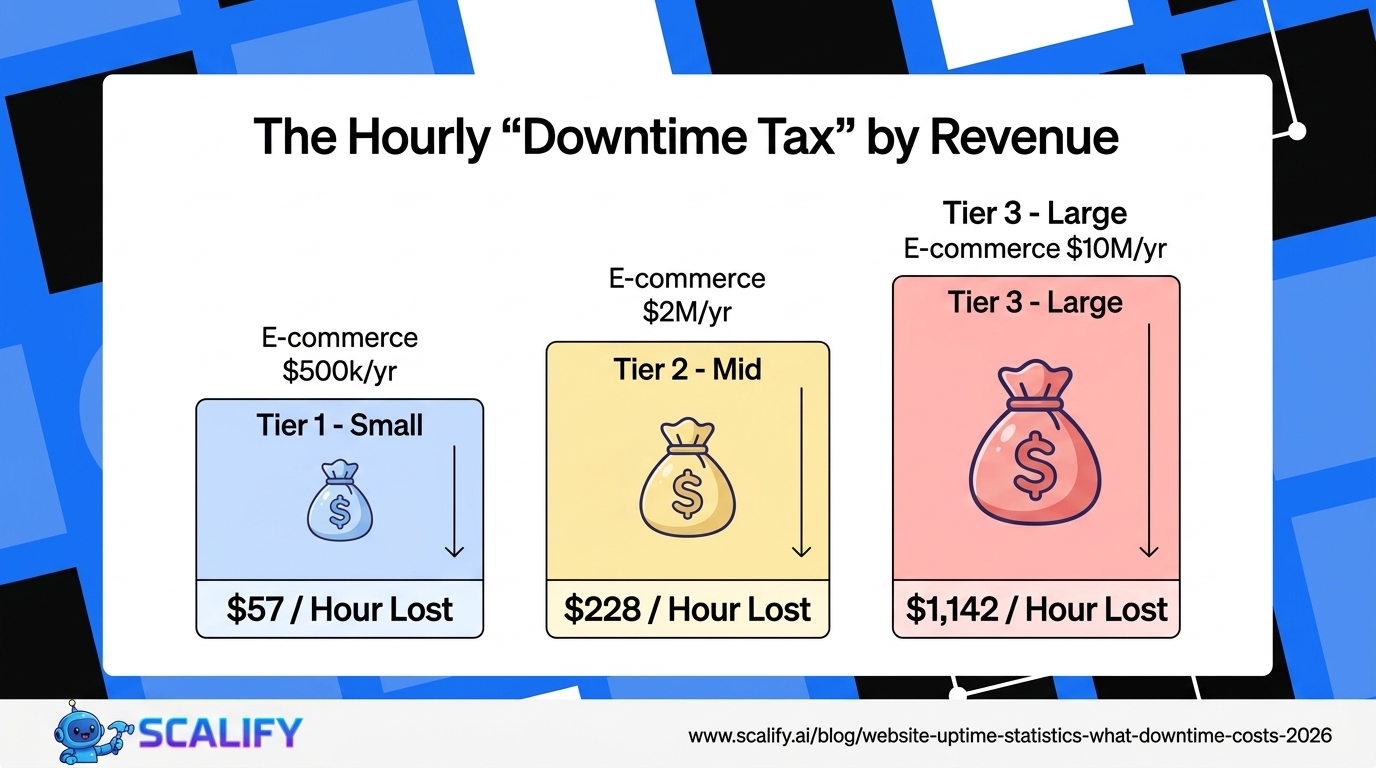
Business TypeRevenue/DayEstimated Cost Per Hour DowntimeAnnual Risk (99% uptime)E-commerce ($500K/yr)~$1,370~$57~$5,000E-commerce ($2M/yr)~$5,480~$228~$20,000E-commerce ($10M/yr)~$27,400~$1,142~$100,000SaaS (100 new signups/day)~$5,000 pipeline~$208~$18,250Lead gen business ($50K/mo leads)~$1,667~$69~$6,000Local service business~$300 in missed calls~$12~$1,050Large enterprise websiteVariable — brand$5,600 (Gartner avg)~$490,000
These estimates represent direct revenue impact only — lost orders, missed lead conversions, and SaaS trial abandonments. The full cost of downtime includes several additional dimensions that are harder to quantify but commercially significant:
SEO damage: Google's crawlers check website availability regularly. Extended downtime results in pages being removed from the index. For sites that have invested heavily in SEO, losing indexed pages — even temporarily — can reduce organic traffic for weeks to months after the uptime issue is resolved. Google recommends returning HTTP 503 (Service Unavailable) during planned maintenance to signal temporary unavailability, but unplanned downtime often returns server errors that don't distinguish themselves from permanent unavailability.
Customer trust erosion: Research by Ponemon Institute found that 43% of customers who experience a website outage during a purchase attempt do not return to try again. One downtime event captures a negative first impression that is permanent for a meaningful percentage of affected visitors.
Brand reputation: Social media complaints about website downtime have disproportionate reach. A tweet or Reddit post about a popular site being down can reach tens of thousands of people who were not themselves affected — creating negative brand associations that persist beyond the technical issue.
Most Common Causes of Website Downtime
Cause% of Downtime EventsPrevention StrategyServer crashes / hardware failure29%Quality hosting with redundant infrastructureTraffic spikes / overload21%Scalable hosting, CDN, cachingDNS issues14%Reputable DNS provider, TTL managementSoftware/plugin updates gone wrong13%Staging environment, careful update processSecurity attacks (DDoS, brute force)12%WAF, DDoS protection, security pluginHuman error (accidental deletion, misconfiguration)7%Role permissions, staging, backup restorationThird-party integrations failing4%Timeout handling, graceful degradation
The 21% of downtime caused by traffic spikes is particularly instructive because it represents a success problem — a business generates a spike in traffic (from press coverage, a viral post, a marketing campaign, or seasonal demand) and the resulting traffic exceeds the hosting plan's capacity, causing the site to slow dramatically or go offline entirely. This is the scenario most business owners haven't planned for and the one most likely to occur at the worst possible moment.
A restaurant website that goes down on Yelp's "Top 100 restaurants" list publication day, a retailer whose server crashes on Black Friday, or a startup whose website goes offline the day their TechCrunch article publishes — these are not hypothetical scenarios. They happen regularly to businesses that haven't planned hosting capacity for their best-case traffic scenarios, not just their average traffic.
Uptime Monitoring: What You Don't Know Is Hurting You
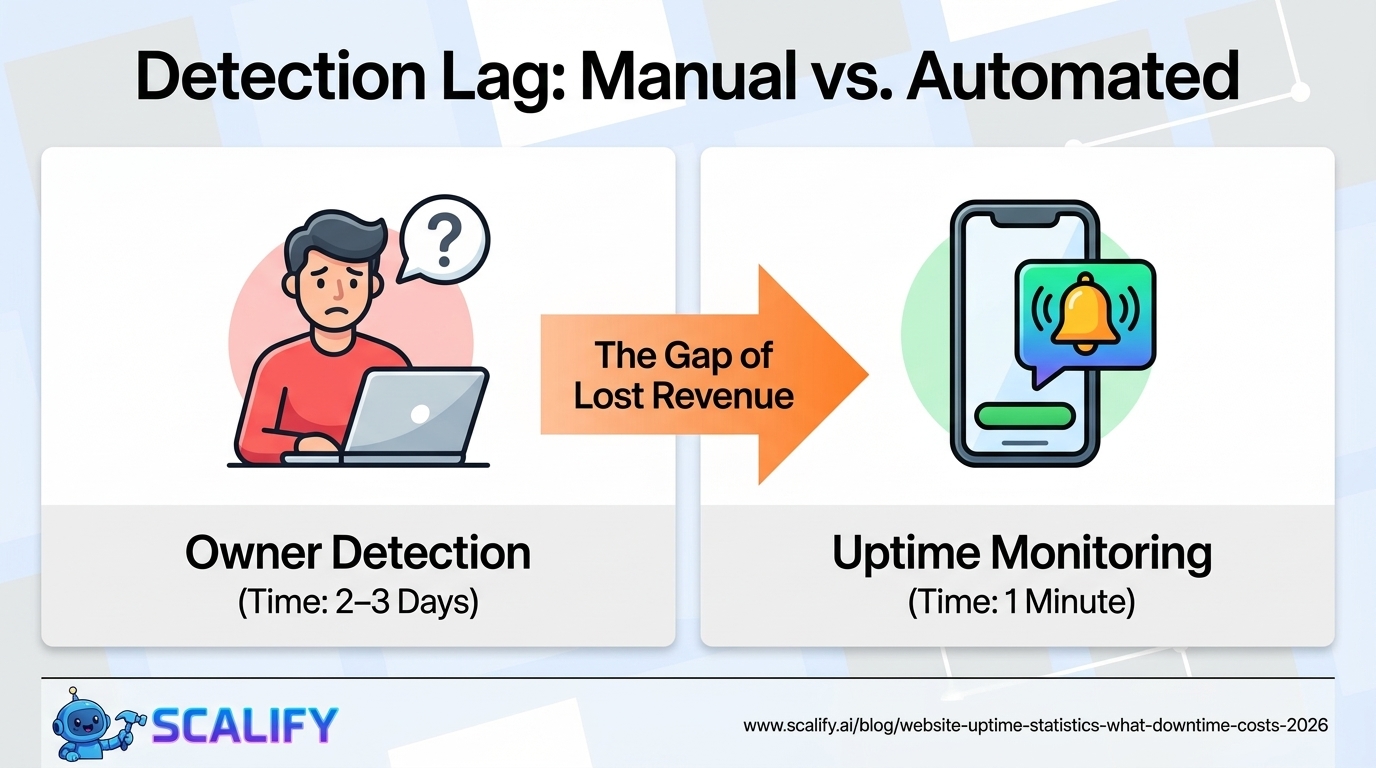
A disturbing dimension of the website downtime problem: most small business website owners don't know when their site is down. Without active monitoring, a website can be offline for hours — or days — before anyone notices. The typical detection path for unmonitored sites:
Detection MethodAverage Time to DetectionNotesOwner happens to visit siteHours to daysMost common unmonitored scenarioCustomer emails to report problem4–24 hoursOnly the most motivated customersSocial media complaint2–12 hoursOnly for high-traffic sitesSales drop triggers investigation1–3 daysDelayed and impreciseAutomated uptime monitor (1-minute checks)1–2 minutesThe correct solution
Free uptime monitoring tools (UptimeRobot, Freshping) check websites every 1–5 minutes and send immediate email or SMS alerts when a site goes down. For a business website representing significant revenue, this is essentially a zero-cost insurance policy. The absence of uptime monitoring is a blind spot that costs businesses real money every time it results in extended undetected downtime.
Uptime SLA Benchmarks: What Quality Hosting Looks Like
Hosting ProviderStated SLAIndependent Monitoring AvgMonthly CostKinsta (managed WordPress)99.9%~99.98%$35 – $340/moWP Engine (managed WordPress)99.95%~99.97%$25 – $290/moCloudways (cloud hosting)99.99%~99.98%$14 – $80/moSiteGround (shared/cloud)99.9%~99.91%$5 – $40/moBluehost (shared)99.9%~98.7%$3 – $15/moGoDaddy (shared)99.9%~98.9%$3 – $20/moAWS (EC2/CloudFront)99.99%~99.99%Variable by usage
The gap between premium managed hosting (Kinsta, WP Engine, Cloudways) and budget shared hosting (Bluehost, GoDaddy shared) is significant in real-world uptime measurements. Independent monitoring tools consistently show the budget shared hosting providers delivering below their 99.9% SLA in practice, while managed hosting providers exceed their stated SLAs. The cost difference — $20–$60/month — is easily justified by the downtime cost reduction for any business-critical website.
The Hidden Uptime Problem: Performance Degradation vs Full Downtime
Most uptime monitoring counts a site as "up" as long as it returns any response within a timeout threshold (typically 10–30 seconds). But a website that loads in 15 seconds is functionally "down" from a conversion perspective — 53% of mobile users abandon after 3 seconds.
This creates a class of "partial downtime" that traditional uptime monitoring misses: the site is technically responding, but performance has degraded to the point that no meaningful visitor activity is occurring. Common causes:
True uptime monitoring for business-critical websites should include performance monitoring — tracking actual response times from multiple geographic locations, alerting when response times exceed thresholds (e.g., >2 seconds), and distinguishing between "responding slowly" and "not responding" in the alert logic. Tools like Pingdom and New Relic provide this capability beyond basic uptime monitoring.
Uptime Best Practices: Investment vs Risk Reduction
InvestmentAnnual CostDowntime Risk ReductionROI ContextUptime monitoring (UptimeRobot free)$0Detection time: days → minutesInfinite ROI — free toolQuality managed hosting (Kinsta/WP Engine)$300 – $1,200/yr98.5% → 99.97% uptimeStrong for any >$50K revenue siteCDN (Cloudflare free)$0Traffic spike absorptionInfinite ROI — free tier covers mostCaching plugin (WP Rocket)$59/yrServer load reduction 60–80%Excellent for WordPress sitesDaily offsite backups$60 – $240/yrRecovery time hours → minutesEssential insuranceLoad balancing (multi-server)$200 – $2,000/yrSingle point of failure eliminationRequired for >$500K e-commerce
The Bottom Line
Website uptime statistics reveal a significant gap between the hosting reliability most small businesses have and what business-critical websites require. A 99% uptime guarantee means nearly 90 hours of potential downtime per year — at an average cost of $57–$1,142/hour for e-commerce businesses depending on their revenue. The investment to move from budget shared hosting to quality managed hosting ($20–$60/month) and add free uptime monitoring reduces this risk dramatically, with payback measured in prevented outages rather than months. For any business where the website is a meaningful revenue driver, treating uptime as a business continuity issue — not just a technical spec — is the financially rational approach.
At Scalify, the websites we build are deployed on hosting infrastructure that targets 99.9%+ uptime — because a website that goes down during your best marketing day is worse than not having a website at all.
Top 5 Sources
The compounding nature of consistent execution is the most important concept in digital marketing: individual tactics produce modest results; systematic implementation of multiple well-chosen tactics over 12–24 months produces transformative results. Identify the highest-impact improvements available to your specific situation, implement them with measurement infrastructure in place, and build the discipline to iterate based on what the data shows rather than intuition or industry trends that may not apply to your specific business and market.


.jpeg)

.jpeg)


78 SW 7th St, Miami, FL 33130


