


How Long Does the Average Person Spend on a Website? (2026 Data)
By Josh Ternyak

April 20, 2026
The average person spends 54 seconds on a website — but that single number hides enormous variation by industry, device, and content type. This data-driven guide covers average session duration statistics across contexts, what drives engagement, and what the numbers actually mean for your site.
Key Statistics: Average Time Spent on Websites
Understanding What "Time on Website" Actually Measures
The question of how long the average person spends on a website sounds simple but is methodologically complex in ways that affect how the data should be interpreted. Before diving into benchmarks, understanding what's being measured — and what the limitations of that measurement are — is important context.
Session Duration vs Time on Page vs Engagement Rate
Most analytics platforms (Google Analytics, Adobe Analytics, Mixpanel) measure session duration differently, and each has limitations. Traditional session duration metrics measure the time between when a user first lands on a site and when their last tracked interaction occurs. A user who reads a 2,000-word blog post and then closes the tab without clicking anything may be recorded as having spent very little time on the site — because there was no final "ping" to record the end of session.
Google Analytics 4, released in 2020 and now the standard, introduced "Engaged Sessions" as a more meaningful metric: sessions lasting more than 10 seconds, sessions with at least one conversion event, or sessions with at least two pageviews. The engagement rate metric — the percentage of sessions that qualify as "engaged" — is increasingly preferred over raw bounce rate and session duration as a measure of content quality.
The 54-second average cited in the key statistics is a median figure from Contentsquare's large-scale analysis of actual tracked user behavior across billions of sessions, weighted toward passive scroll behavior measurement rather than click-dependent analytics. This makes it more accurate for single-page sessions where users read content without clicking additional links.
The Bounce Rate Context
A "bounce" — a session with a single pageview — is not inherently bad. A user who searches "what is the capital of France," lands on a page that immediately answers "Paris," and leaves has completed a successful task. A user who lands on an e-commerce product page, reads the product description, checks the reviews, and then leaves without purchasing is a bounce — but a much more engaged one that might convert on a return visit. Bounce rate as a single number tells you little without knowing the intent of the traffic.

Average Session Duration by Industry
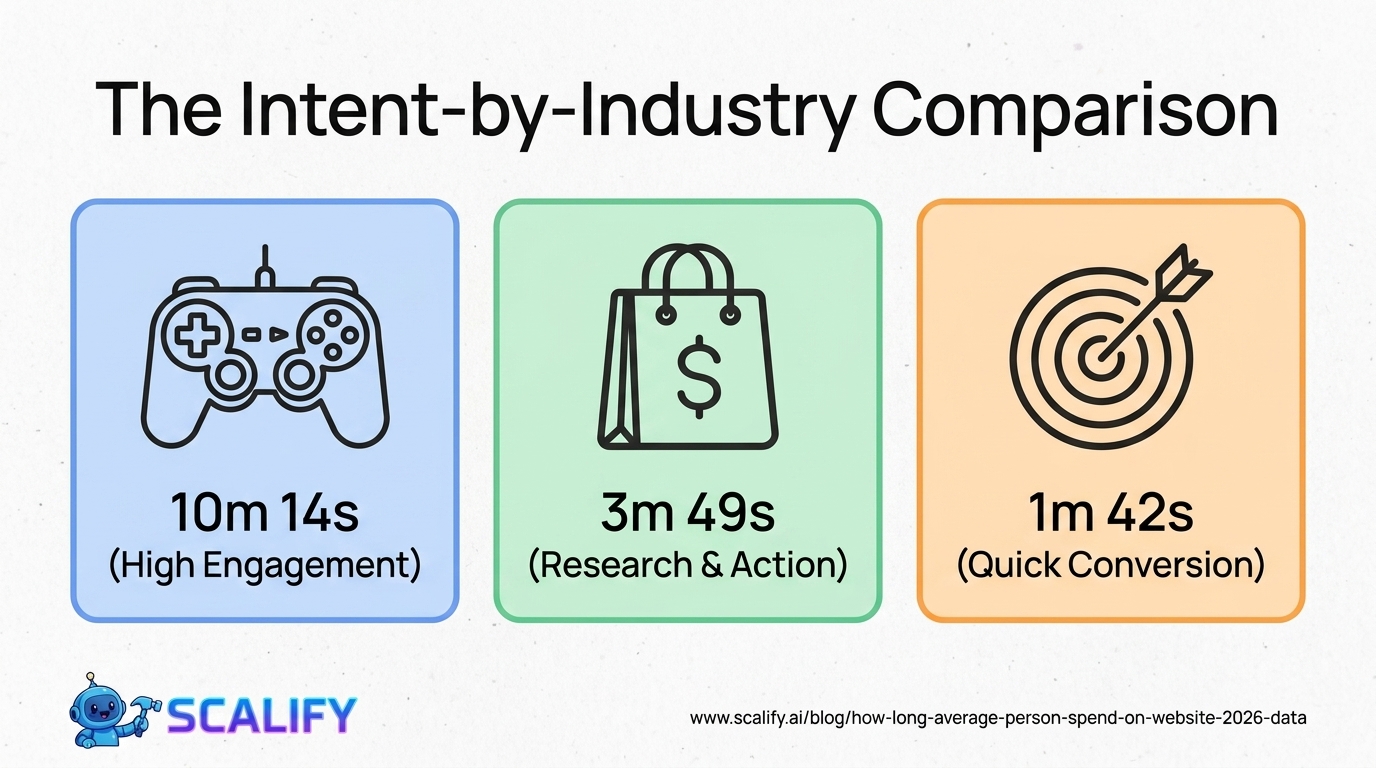
Industry / Website TypeAvg Session DurationAvg Pages Per SessionBounce RateE-Commerce (product browsing)3m 49s4.933%Online Gaming / Interactive10m 14s9.228%B2B SaaS / Software3m 21s3.836%News & Publishing2m 42s4.341%Finance & Banking3m 15s3.938%Healthcare / Medical4m 12s4.135%Education & E-Learning5m 24s5.230%Travel & Hospitality4m 01s5.434%Real Estate3m 45s4.837%Legal / Professional Services2m 48s2.943%Restaurants / Food Service2m 12s2.452%Landing Pages (single goal)1m 42s1.072%Blog / Content Sites3m 36s2.848%
The enormous variation in session duration across industries — from 1m 42s for landing pages to 10m 14s for online gaming — reflects the different purposes websites serve and the different tasks visitors are completing. Online gaming websites have long sessions because entertainment consumption is the purpose. Landing pages have short sessions (and high bounce rates) by design — they're built for a single action, and a high bounce rate on a landing page with a strong conversion rate is a success, not a failure.
Average Time on Page by Content Type
Content TypeAvg Time on PageWhat Good Looks LikeHomepage45s – 1m 30sUser navigates deeper within 90 secondsBlog post (under 500 words)1m 00s – 2mRead rate matches expected reading timeBlog post (1,500–2,500 words)3m – 5mSignificant scroll depth, multiple sectionsLong-form content (3,000+ words)5m – 10mHigh scroll depth, multiple engagement eventsProduct page (e-commerce)2m – 4mImage views, review reading, size selectionPricing page2m 30s – 4mHigh-intent behavior — multiple plan comparisonsAbout page1m – 2m 30sTeam/history reading, indicates trust-buildingContact page30s – 1m 30sForm completion is the action; short visit is fineFAQ page1m 30s – 3mMultiple question scanning, answers found quicklyVideo pageVariable (video length)Completion rate matters more than time on page
The First 15 Seconds: What Nielsen Norman Group Research Shows
The single most important finding in user attention research for websites comes from Nielsen Norman Group's landmark studies on how quickly users form judgments about whether to stay or leave. Their research, based on eye-tracking studies and behavioral analysis across thousands of user sessions, established several foundational findings that still hold in 2026:
Users decide in 10–20 seconds whether to stay on a website. The first 10 seconds of a page visit are the most critical period — users are rapidly scanning the page to answer a fundamental question: "Is this what I was looking for?" If the answer isn't clearly "yes" within 15–20 seconds, most users leave. The implication: the above-the-fold content on any page carries disproportionate weight for visitor retention.
If users stay past 30 seconds, the probability they will stay significantly longer increases substantially. There's a threshold effect at approximately 30 seconds — users who invest this much time have validated that the content is relevant to their needs and are much more likely to continue reading. Getting users past this threshold through clear value proposition communication and relevant above-the-fold content is one of the most valuable engagement goals.
Users read in an F-pattern or Z-pattern, not linearly. Eye-tracking research shows that most web readers scan in an F-shaped pattern (heavy reading of the first line, less on the second, then a vertical scan down the left side) or Z-pattern (top left to top right, diagonal to bottom left, bottom left to bottom right). This means the most important content should be front-loaded in paragraphs, headlines should be scanned even when body text isn't read, and left-alignment of key information serves users better than centered alignment.
The average user reads only 20–28% of the text on a web page. This finding — one of the most cited in UX research — means that most written content on most web pages is never read. The practical implication isn't to write less content (longer content can rank better in search and serve users who want depth), but to structure content for scanning: clear headings every 2–3 paragraphs, bold key phrases, short first sentences, and clear visual hierarchy that lets users navigate to the sections most relevant to them.
Time on Site vs Scroll Depth: A More Complete Picture
Session duration alone doesn't fully capture engagement. A user who bounces after 45 seconds might have deeply read the first 60% of a page — which would be measured as an engaged visit if scroll depth were tracked. A user who keeps a page open for 8 minutes while distracted by a phone call adds session time without engagement. The combination of session duration with scroll depth is a more accurate engagement signal:
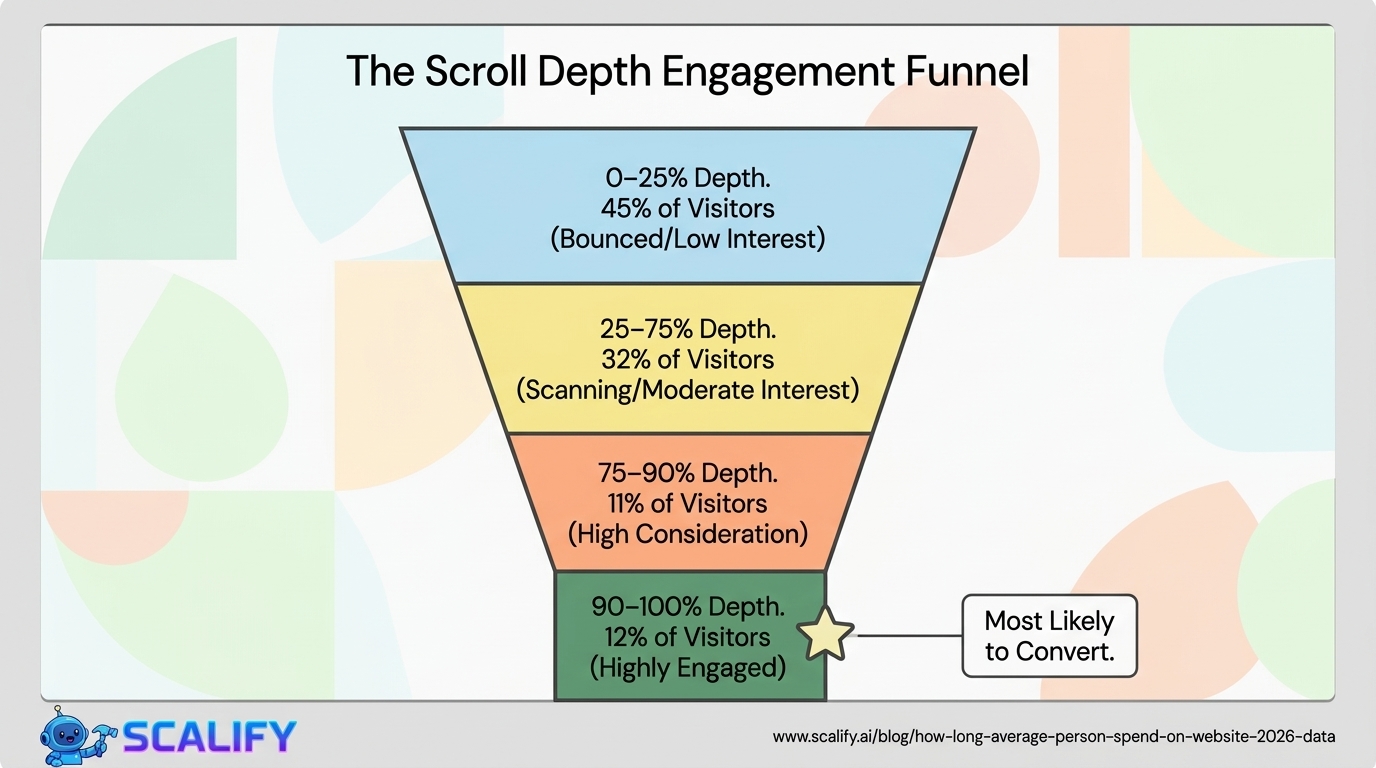
Scroll Depth Reached% of VisitorsEngagement Signal0–25% (above the fold only)~45%Low engagement, likely bounced25–50%~18%Some interest, scanning headlines50–75%~14%Moderate engagement, actual reading75–90%~11%Strong engagement90–100% (bottom of page)~12%Highly engaged, looking for next action
The 12% of visitors who scroll to the bottom of a page — the most engaged segment — are the group most likely to convert. This has direct design implications: putting a primary CTA at the very bottom of important pages (in addition to above-the-fold CTAs) captures the highest-intent audience that conventional "CTA above the fold" guidance leaves unaddressed.
Device-Specific Engagement Patterns
MetricMobileDesktopTabletAvg session duration3m 42s7m 12s5m 48sAvg pages per session2.74.23.8Avg scroll depth46%54%52%Bounce rate51%43%47%Return visitor rate28%38%32%
Mobile's lower session duration and scroll depth reflect a behavioral reality about mobile browsing: it often occurs in interrupted, context-switching environments — a few minutes on a commute, a brief check between tasks, a quick lookup in the middle of a conversation. Desktop sessions happen in more focused contexts — dedicated research time, extended shopping sessions, professional work. This context difference is more responsible for the engagement gap than screen size or usability differences.
What Affects How Long People Stay on Your Website
Page Load Speed
Every additional second of load time reduces session duration by an estimated 7–12%. Users who wait longer for a page to load arrive with depleted patience, are more likely to leave on the first subpar experience, and are less likely to click through to additional pages. Speed and engagement are directly correlated — pages that load in under 2 seconds have average session durations 35% longer than pages loading in 5+ seconds, independent of content quality.
Content Relevance and Quality
The most powerful driver of session duration is whether the content actually delivers on the promise that brought the visitor there. If a user clicks a Google result titled "Best running shoes for flat feet" and lands on a generic shoe category page, they leave immediately. If they land on a genuinely useful guide comparing the top 10 options with detailed flat-feet-specific analysis, they stay, read, and engage. Intent match — alignment between what the user was searching for and what the page delivers — determines session duration more than any design or technical factor.
Internal Linking and Content Architecture
Users who visit multiple pages have dramatically longer sessions than single-page visitors. The pages-per-session data for sites with good internal linking (3–5 pages) vs. sites without (1.5–2 pages) reflects the downstream effect of intelligent content architecture. Including relevant internal links to related content within body text, showing related articles at the bottom of blog posts, and building clear site navigation all increase the probability that a satisfied reader continues to additional pages rather than returning to Google.
Readability and Content Formatting
Research consistently shows that well-formatted content — short paragraphs (2–4 sentences), clear headings, bullet points for list content, bold text for key phrases — is read more completely and generates longer session durations than equivalent content in dense, unformatted blocks. Content formatting isn't just aesthetic; it's a functional accommodation of how people actually read on screens.
Visual Design and First Impressions
The famous 50-millisecond visual impression (users form an aesthetic judgment in approximately 50ms) established by Lindgaard et al.'s research explains the threshold effect in session duration data. If the initial visual impression communicates quality, professionalism, and relevance, users invest in reading further. Poor visual design creates immediate trust deficit that short-circuits engagement before content is even read.
Benchmarks for Your Specific Website Type
Rather than comparing against a global average of 54 seconds, the most useful benchmarks are by specific website type and traffic source combination:
Website Type + Traffic SourceTarget Session DurationGood Bounce RateService business (organic search)2m – 3m 30sUnder 55%E-commerce (organic search)3m – 5mUnder 40%SaaS product (all traffic)2m 30s – 4mUnder 45%Blog / content site (organic)3m – 6mUnder 65% (acceptable for news)Portfolio / agency (referral + direct)2m – 4mUnder 50%Landing page (paid traffic)1m – 2m60–80% acceptable if convertingRestaurant / local service1m 30s – 2m 30sUnder 60%
The Relationship Between Session Duration and Conversions
The correlation between session duration and conversion rate is strong but not linear. There's a point of diminishing returns where very long sessions (over 10 minutes) may indicate confusion rather than engagement — a user spending 15 minutes on a checkout page is probably experiencing friction, not satisfaction. The optimal session duration for conversion purposes is:
Research by Semrush analyzing millions of sessions found that the highest-converting sessions average 2–4 minutes in length for most website types. Sessions shorter than 1 minute rarely convert (insufficient engagement). Sessions over 8 minutes have declining conversion probability as confusion and indecision set in. The 2–4 minute sweet spot represents users who found what they needed and proceeded to act without frustration.
The Bottom Line
The average person spends 54 seconds on a website at the aggregate level — but this number is almost meaningless without industry, content type, and device context. E-commerce sessions average nearly 4 minutes; online gaming over 10 minutes; restaurant websites just over 2 minutes. Users form first impressions in 50 milliseconds and decide to stay or leave within 15–20 seconds, making above-the-fold content the most critical real estate on any page. The highest-converting sessions average 2–4 minutes — long enough for informed decisions, short enough to indicate clear navigation. Improving session duration through relevant content, fast load times, good formatting, and intelligent internal linking has a direct measurable correlation with conversion rates.
At Scalify, we design websites to engage visitors from the first 15 seconds — clear value propositions, fast load times, and intuitive navigation that keeps users on-site long enough to convert.
Top 5 Sources


.jpeg)

.jpeg)


78 SW 7th St, Miami, FL 33130


