


What Percentage of Revenue Comes from Business Websites? (2026 Data)
By Josh Ternyak

April 20, 2026
For businesses with websites, the web channel contributes between 15% and 80%+ of total revenue depending on industry and business model. This data guide breaks down exactly how much revenue websites generate across business types, with research from multiple independent sources.
Key Statistics: Website Revenue Contribution
Why This Question Is Hard to Answer Simply — And What It Actually Means
The question of what percentage of revenue comes from business websites has multiple correct answers depending on what you're measuring. Revenue attribution is genuinely complex because customer journeys are nonlinear — a customer might first discover a business through a Google search, visit the website, not convert, see a social media ad, come back to the website, and then call the business directly. Should that revenue be attributed to organic search, social media, the website, or the phone call?
The most useful way to frame this question is: what would happen to revenue if the website were removed? That counterfactual — while impossible to test directly — is what's being approximated in the research cited throughout this guide. And the consistent finding across multiple methodologies and research organizations is that website presence has a substantial, measurable effect on revenue across virtually every business category.
We'll break this down by business type, because the web channel's revenue contribution is one of the most variable statistics in business research — driven by fundamental differences in sales cycles, purchase decision processes, and customer behavior across industries.
Website Revenue Contribution by Business Type
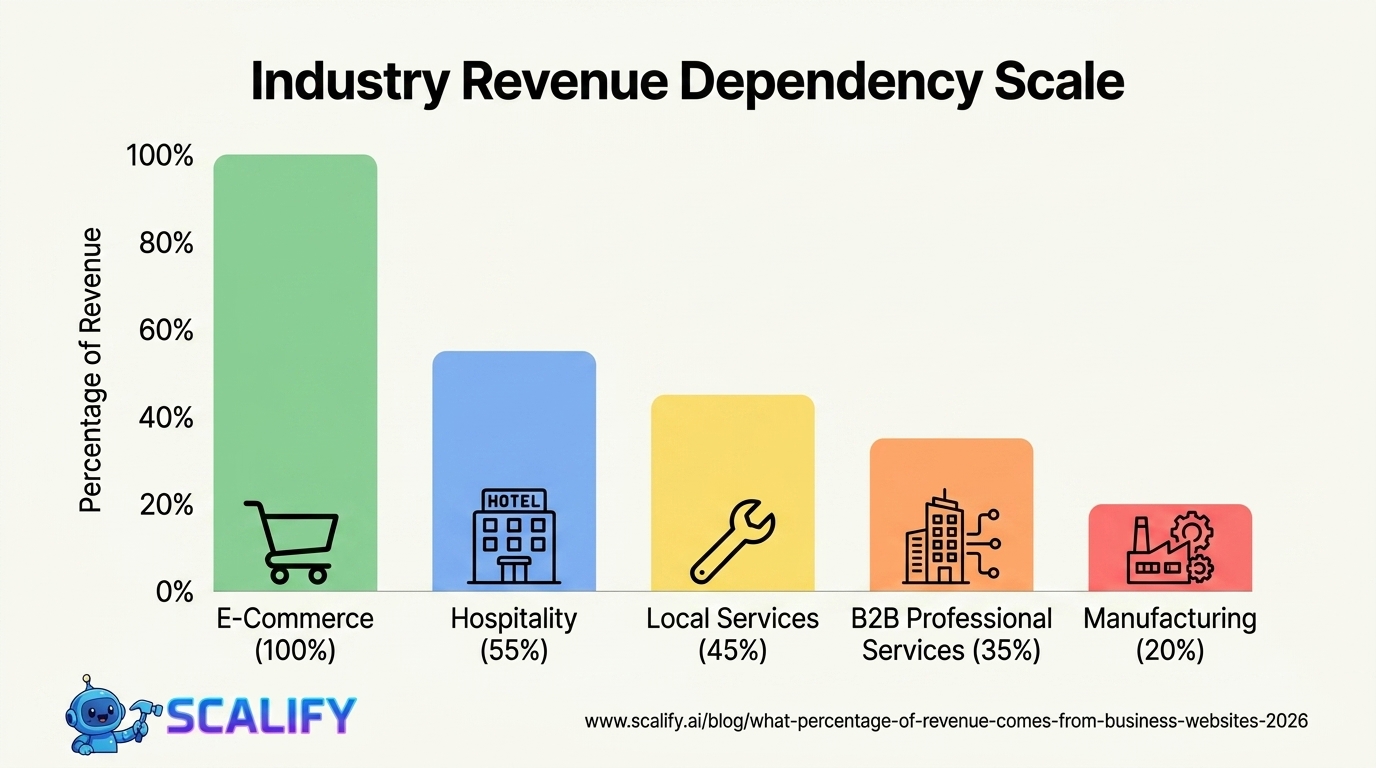
Business TypeEst. Revenue % From Web ChannelPrimary MechanismE-Commerce (direct to consumer)100%Direct transactionsSaaS / Software Products80–100%Free trial signup, purchase, self-serveDigital Products / Courses90–100%Online purchase, subscriptionReal Estate Agency40–60%Lead gen, property listings, contact formsLegal Services30–50%Consultation requests, organic searchHealthcare / Medical Practice25–45%Appointment bookings, insurance lookupB2B Professional Services25–40%Lead generation, content marketingLocal Service Business (HVAC, plumbing)35–55%Local search, Google Maps, quote requestsRestaurant15–30%Online ordering, reservations, discoveryRetail (omnichannel)20–35%E-commerce component, product researchHospitality / Hotels45–65%Direct bookings, competing with OTAsManufacturing / Industrial B2B15–25%Lead gen, spec sheets, distributor finder
E-Commerce: The Clearest Case
For e-commerce businesses, website revenue attribution is unambiguous — online transactions are the business model. But even within e-commerce, the distinction between "the website generates revenue" and "the website is optimized to maximize revenue it generates" is enormous. Industry data consistently shows that:
B2B: The 57% Rule and Website's Role in the Sales Cycle
The CEB/Gartner research finding that B2B buyers complete 57% of their purchase journey before contacting a vendor is one of the most widely cited statistics in B2B marketing — and it has profound implications for how B2B companies should think about their website's revenue contribution.
If a $50,000 B2B software contract is sold by a salesperson after a 90-day sales cycle, the intuitive attribution might give 100% credit to the sales team. But the CEB/Gartner research suggests that the buyer had already evaluated vendor websites, read case studies, compared feature sets, watched demo videos, and formed strong preferences before that first sales call. The website — specifically, its content depth, case studies, pricing transparency, and trust signals — was doing the work that made the sales process possible.
More recent research from Gartner (2023) found the number has increased: B2B buyers now complete 65–70% of the purchase journey digitally before engaging with a sales representative. This percentage has grown significantly since the pandemic accelerated digital-first buying behaviors across all industries.
B2B Purchase Stage% Happening Digitally / WebsiteWhat Buyers Are DoingProblem identification~80%Searching for solutions to recognized problemsSolution exploration~75%Reading vendor content, comparison guides, reviewsRequirements building~65%Feature comparison pages, documentation reviewSupplier selection~55%Case studies, testimonials, security docsValidation~60%Peer reviews (G2, Capterra), reference callsConsensus creation~50%Sharing vendor content internally with stakeholders
This data means that for B2B companies, the website is not just a lead generation tool — it's the primary venue where most of the purchase decision happens. A B2B website that lacks detailed case studies, clear feature documentation, pricing transparency (even ranges), security and compliance information, and testimonials from recognizable clients is failing to support the buyer's journey at the stages where it matters most.
Local Service Businesses: The Local Search Revenue Engine
For plumbers, HVAC companies, landscapers, electricians, and similar local service businesses, the revenue relationship between website and business outcomes is among the most direct of any business category — and among the most underappreciated by the businesses themselves.
BrightLocal's annual Local Consumer Review Survey documents consistently that:
The local service business that shows up in Google search results for "emergency plumber [city name]" at 11pm on a Sunday night is capturing extremely high-intent traffic that converts to paid service calls at rates dramatically higher than most other traffic sources. These searches represent customers actively experiencing a problem who need a solution immediately — the highest possible buyer intent.
Research from the Home Services Alliance found that local service businesses with optimized websites and Google Business Profiles (formerly Google My Business) received 38% more service calls than comparable businesses with minimal web presence. At average ticket values of $200–$500 for typical home service calls, this represents a meaningful revenue differential that dramatically outweighs typical web presence costs.
The Professional Services Revenue Calculation
For law firms, accounting firms, consulting firms, and other professional services businesses, the website's revenue contribution is primarily through lead generation — converting visitors into consultation requests that become clients. The revenue math here is particularly compelling because the lifetime value of a professional services client is typically very high:
MetricExample Professional Services FirmMonthly website visitors2,000Consultation form conversion rate2.5%Monthly consultation requests50Close rate (consultations to clients)30%New clients per month from website15Average first-year revenue per client$8,000Monthly revenue from website channel$120,000Annual revenue from website channel$1.44 million
These are not hypothetical — they reflect the actual calculation that well-run professional services firms with active organic search strategies experience. A personal injury law firm ranking first for "car accident attorney [city]" may receive hundreds of consultation requests monthly from its website — a revenue-generating machine that runs without proportional cost scaling.
Hospitality: The Battle Against OTAs
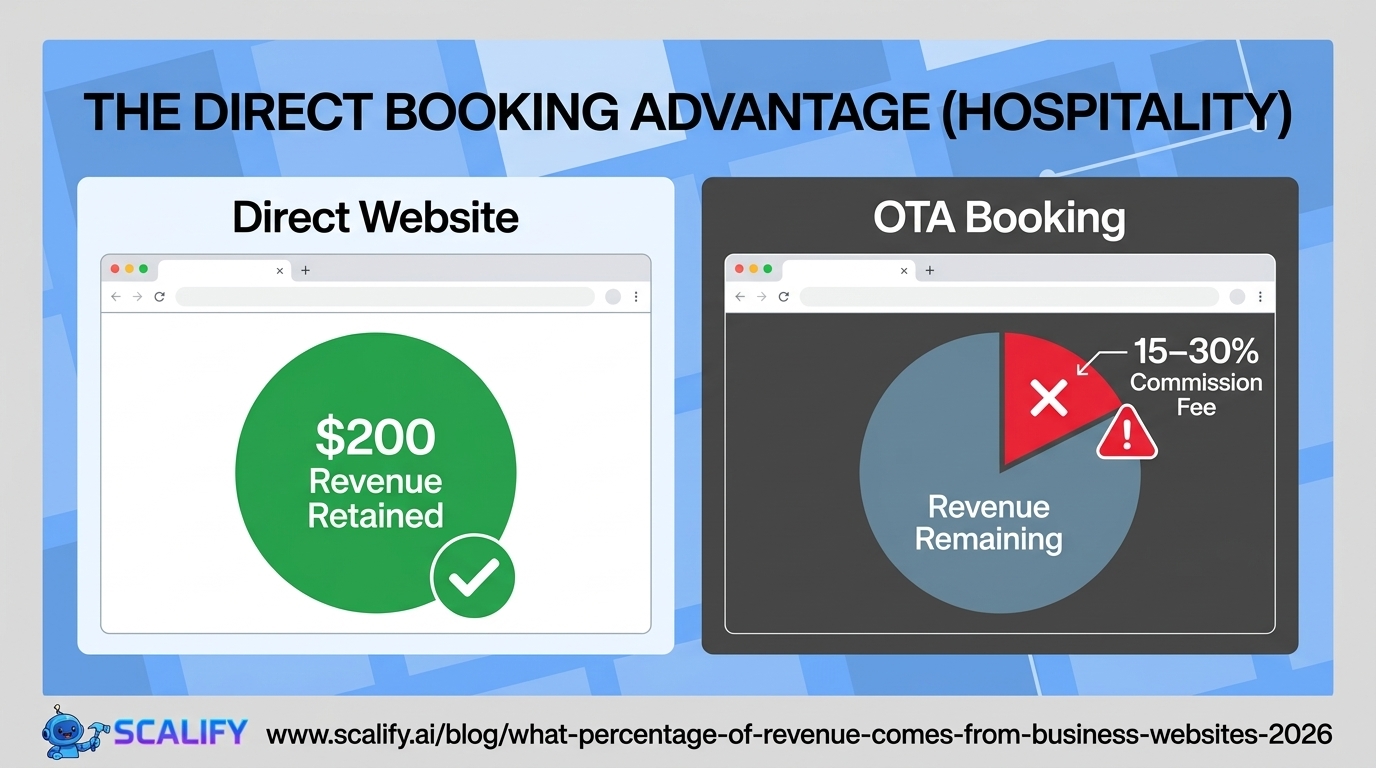
For hotels and vacation rentals, the website's revenue contribution has a specific strategic dimension: direct bookings through the hotel's own website versus bookings through online travel agencies (OTAs) like Expedia, Hotels.com, and Booking.com. OTA commissions typically range from 15–30% of booking value — meaning a $200/night hotel booking through Expedia costs the hotel $30–$60 in commission fees that a direct website booking would retain.
Hotels that have invested in direct booking optimization — Best Rate Guarantees, loyalty program integration, seamless mobile booking, and clear value-add for direct bookings (free breakfast, room upgrades, early check-in) — report direct booking rates of 35–45% or higher. Hotels without these optimizations see 70–80% of bookings flowing through OTAs at full commission cost. The revenue impact of this difference, compounded over annual booking volume, is substantial and directly attributable to website investment.
ROI of Website Investment: What the Research Shows
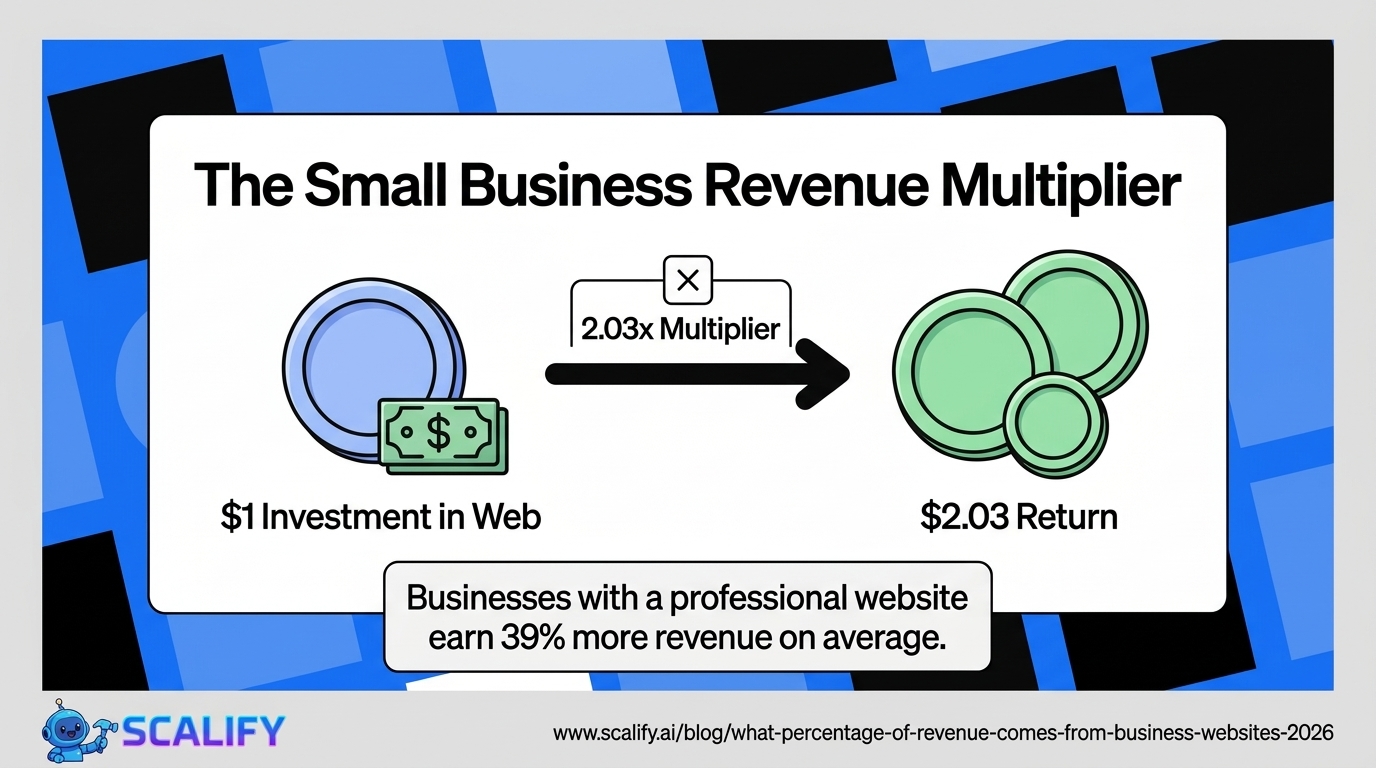
Study / SourceKey FindingDeloitte Connected Small BusinessSmall businesses with websites earn 39% more revenue on averageGoDaddy / Deloitte Joint Research$2.03 returned for every $1 invested in web presenceNFIB / Verisign SurveyBusinesses without websites lose avg $70,000/yr in potential revenueClutch Small Business Research46% of small businesses with websites report it as their most valuable marketing toolMcKinsey Digital Revenue ResearchCompanies with mature digital channels grow revenue 3.5x faster than digital laggards
What Separates High-Revenue Websites from Low-Revenue Websites
Within any industry, there are businesses whose websites generate significant revenue and businesses whose websites are essentially inactive digital brochures. The differences are predictable and measurable:
Search Visibility
A website that no one finds generates no revenue. Organic search is the primary discovery channel for most business websites — appearing in the top 3 results for relevant searches generates traffic that directly correlates with revenue. Websites with active SEO strategies (regular content creation, local citation management, technical optimization) generate orders of magnitude more search traffic than those without.
Conversion Rate Optimization
The difference between a 1% and 3% website conversion rate on the same traffic volume represents a 200% difference in leads or sales generated. Clear calls-to-action, mobile-optimized forms, trust signals, fast load times, and compelling value propositions are the primary drivers of conversion rate — all controllable through website design and optimization.
Mobile Experience Quality
Given that 58–64% of web traffic is mobile, websites that provide poor mobile experiences are failing to convert the majority of their visitors. Mobile checkout friction, small tap targets, slow load times, and non-mobile-optimized forms all reduce mobile conversion rates — and therefore reduce the revenue the website generates per unit of traffic.
Trust Infrastructure
Reviews, testimonials, case studies, security badges, professional photography, and clear contact information all contribute to the trust signals that convert website visitors into customers. Research consistently shows that adding genuine social proof near conversion points increases conversion rates by 25–40% — meaning trust infrastructure directly translates to revenue.
The Bottom Line
Website revenue contribution ranges from 100% for pure e-commerce and SaaS businesses to 15–25% for manufacturing and industrial B2B companies, with the majority of industries falling in the 25–55% range for businesses with active web strategies. B2B buyers complete 65–70% of their purchase journey digitally before contacting vendors, making website content infrastructure a primary sales driver even when the sale closes via human relationship. Local service businesses with optimized web presence receive 38% more service calls. Professional services firms with active SEO strategies can generate seven-figure annual revenue from their website channel alone. The research across multiple independent sources consistently finds that businesses with professional web presence generate 39%+ more revenue than comparable businesses without — making website investment one of the highest-ROI business decisions available across virtually every business category.
At Scalify, we build professional websites engineered to generate revenue — not digital brochures, but conversion-optimized platforms built to be your best-performing sales channel.
Top 5 Sources


.jpeg)

.jpeg)


78 SW 7th St, Miami, FL 33130


