

.jpeg)
How to Speed Up Your Website (And Why It Matters for SEO) (2026)
By Josh Ternyak

April 18, 2026
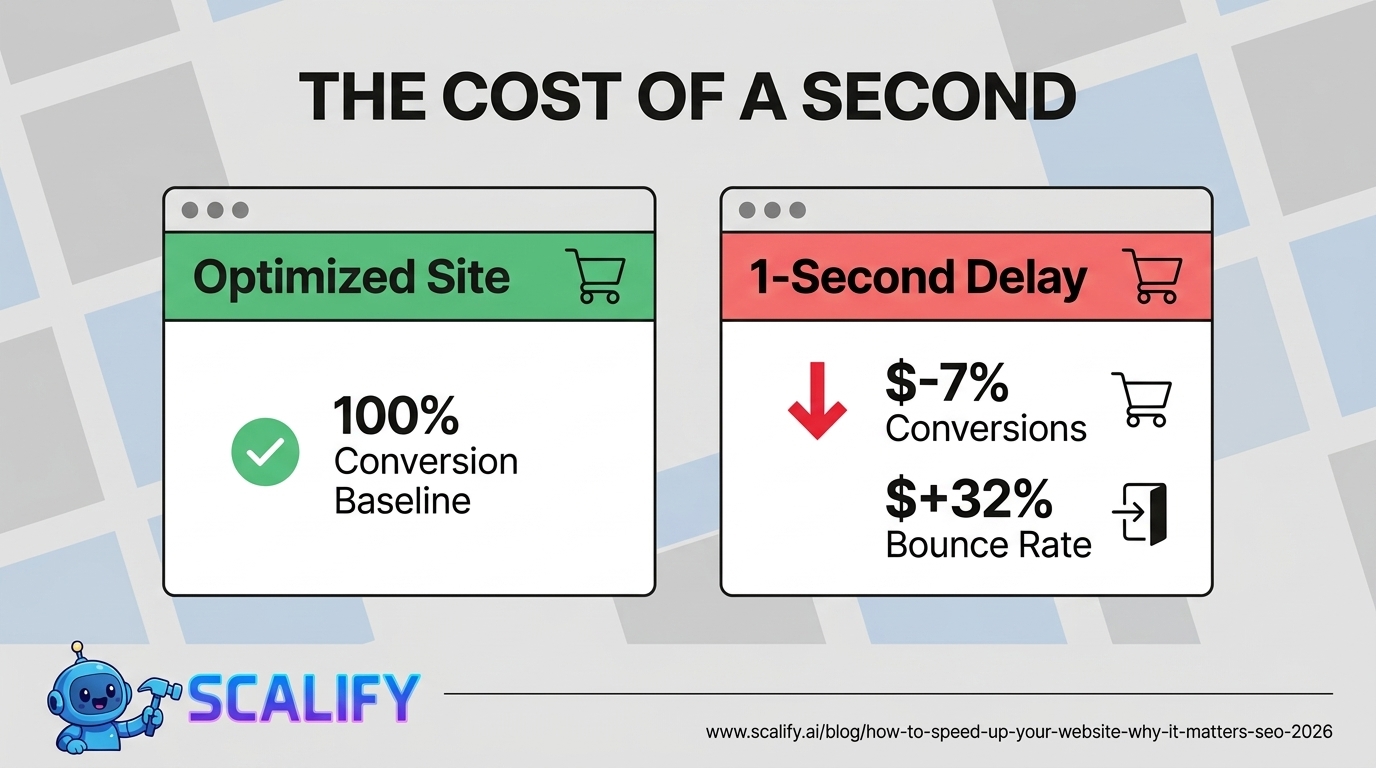
A 1-second page speed delay reduces conversions by 7% and directly impacts Google rankings through Core Web Vitals. This comprehensive guide covers measuring speed, Core Web Vitals targets, image optimization, hosting quality, caching, CDN setup, platform-specific fixes for WordPress, Webflow and Shopify, third-party script management, and ongoing performance monitoring.
How to Speed Up Your Website (And Why It Matters for SEO)
Website speed is simultaneously a user experience problem, an SEO ranking problem, and a conversion rate problem. A one-second delay in page load time reduces conversions by 7%, increases bounce rate by 32%, and directly damages Google rankings through Core Web Vitals signals that Google uses as ranking factors. The businesses that treat page speed as a pure technical concern miss the commercial urgency that the data establishes: slow websites lose money directly and measurably, not just in abstract ranking degradation but in the percentage of real visitors who leave before converting.
Key Statistics: Page Speed and Business Impact
How to Measure Your Current Speed
ToolWhat It MeasuresURLBest Used ForPageSpeed InsightsCore Web Vitals + Lighthouse score with real user datapagespeed.web.devFirst assessment — most important toolGoogle Search ConsoleReal-world Core Web Vitals across all pagessearch.google.com/search-consoleSite-wide performance with actual user dataGTmetrixWaterfall chart, load time breakdown by resourcegtmetrix.comDiagnosing which specific resources are slowWebPageTestDeep technical analysis, multiple locationswebpagetest.orgAdvanced diagnosis, geographic performance testingChrome DevToolsNetwork tab, Performance profiler, LighthouseBuilt into Chrome (F12)Developer-level diagnosis and profiling
Core Web Vitals: Google's Performance Ranking Signals
MetricWhat It MeasuresGoodNeeds WorkPoorLCP (Largest Contentful Paint)How fast the main content loadsUnder 2.5s2.5–4.0sOver 4.0sINP (Interaction to Next Paint)Page responsiveness to user inputUnder 200ms200–500msOver 500msCLS (Cumulative Layout Shift)Visual stability — elements jumping aroundUnder 0.10.1–0.25Over 0.25
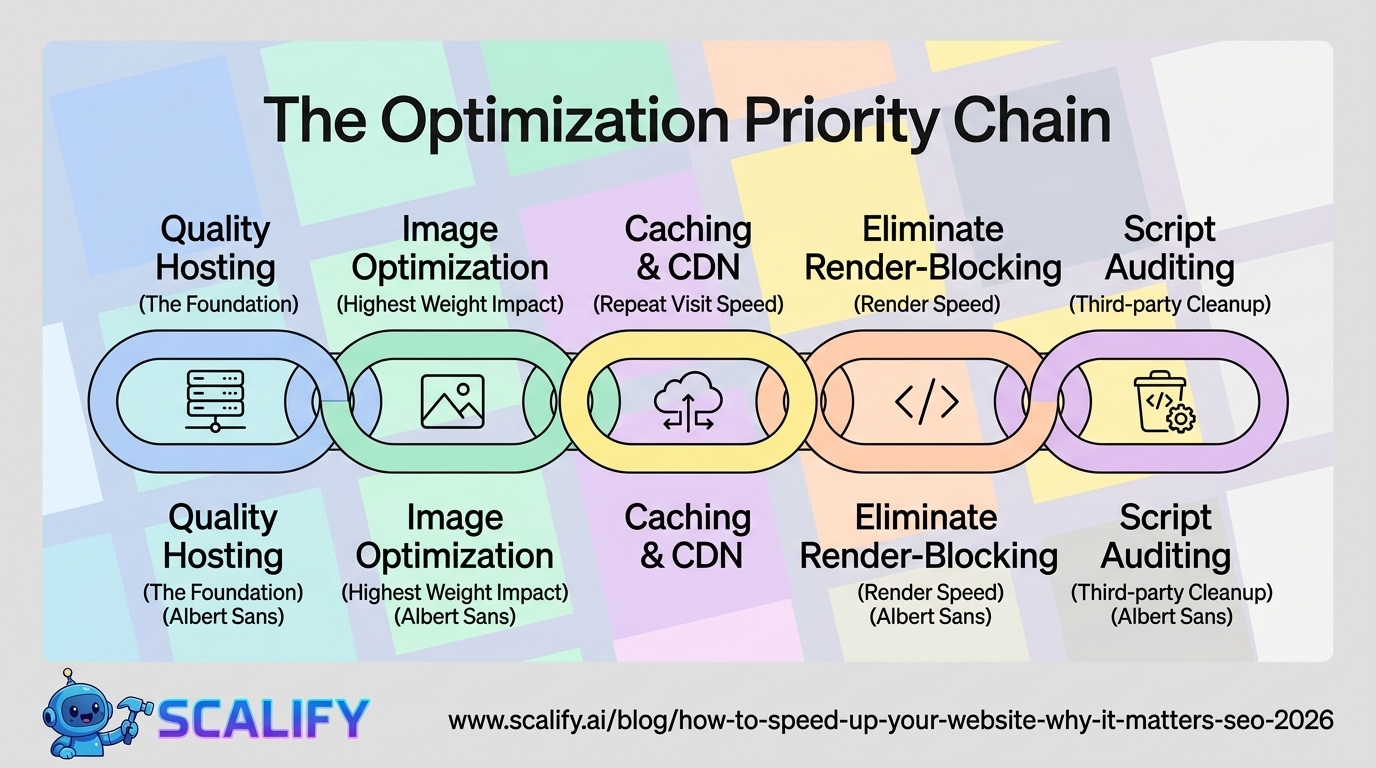
The Priority Speed Optimizations
1. Image Optimization (Highest Impact — 40-70% of Page Size)
Images are the single largest contributor to page weight on most websites. An unoptimized 4MB JPEG from an iPhone camera is the most common cause of failing Core Web Vitals — and the fix is entirely straightforward.
Image Optimization ActionImpactHow To Do ItCompress images before upload50–80% file size reductionTinyPNG, Squoosh, ImageOptimUse WebP format instead of JPEG/PNG25–35% smaller at same qualityExport as WebP or use server-side conversionImplement lazy loadingReduces initial page load significantlyAdd loading="lazy" to img tags below the foldServe correct dimensionsEliminates browser resize workResize images to display size before uploadingPreload hero/LCP imageDirectly improves LCP metriclink rel="preload" as="image" in head
2. Hosting Quality (The Foundation)
Hosting LevelTypical TTFBLCP ImpactMonthly CostBudget shared hosting ($3–5/mo)800ms–2,000msVery slow — often causes LCP failure$3–$5Quality shared hosting400ms–800msSlow — LCP borderline$15–$25Managed WordPress (Kinsta, WP Engine)100ms–300msFast — LCP easily achievable$30–$100VPS / Cloud100ms–400msFast with proper configuration$20–$80
Google recommends TTFB (Time to First Byte) under 200ms. Budget shared hosting frequently delivers 800ms–2,000ms TTFB — before a single byte of content loads. If you're on budget shared hosting and seeing poor Core Web Vitals, upgrading hosting is likely the single highest-ROI change available. Every other optimization is fighting against the hosting foundation.
3. Caching (Speeds Up Repeat Visits)
Caching stores a generated version of pages so they serve instantly without running database queries on every request. For WordPress sites, a caching plugin is essential: WP Rocket ($59/yr) is best-in-class, LiteSpeed Cache (free) is excellent if your host uses LiteSpeed servers, and Cloudflare's free tier provides CDN + caching + DDoS protection with significant speed improvements for geographically distributed audiences.
4. CDN (Content Delivery Network)
A CDN stores copies of static files on servers around the world. Without a CDN, every Australian visitor to a US-hosted site waits for files to travel thousands of miles. With a CDN, those files serve from the nearest global server. Cloudflare's free tier is the starting point for most websites — it's genuinely free, covers most use cases, and consistently reduces page load times by 20–40% for geographically distributed audiences.
5. Eliminate Render-Blocking Resources
Render-blocking scripts and stylesheets force the browser to pause rendering until they load. The fixes: add defer or async attributes to JavaScript tags that don't need to execute before page render, inline critical CSS (the styles needed for above-the-fold content) in the HTML head and load the rest asynchronously, and audit third-party scripts (Google Analytics, Facebook Pixel, live chat, heatmap tools) — each one adds latency, and unused scripts should be removed entirely.
Fixing Core Web Vitals: Specific Actions
Improving LCP (Target: Under 2.5 seconds)
Improving CLS (Target: Under 0.1)
Improving INP (Target: Under 200ms)
Speed Targets to Aim For
MetricTargetPriorityLighthouse Mobile Score80+Very HighLCPUnder 2.5 secondsVery HighINPUnder 200msHighCLSUnder 0.1HighTTFBUnder 200msHigh — address with better hostingTotal page weightUnder 1MB ideally under 500KBMedium-High
WordPress-Specific Speed Optimizations
IssueFixBloated database (old revisions, spam comments)WP-Optimize plugin to clean database quarterlyToo many active pluginsDeactivate and delete unused plugins — each adds overheadOutdated PHP versionUpdate to PHP 8.x — significantly faster than PHP 7.xNo object cachingEnable Redis or Memcached — managed hosts often provide this freeLarge unoptimized images in media libraryShortPixel or Imagify for bulk retroactive compression
The Bottom Line
Page speed optimization has three distinct ROI mechanisms: direct conversion rate improvement (7% per second of delay), SEO ranking improvement (Core Web Vitals are active ranking signals), and reduced bounce rate (53% of mobile visitors abandon pages loading over 3 seconds). The highest-impact fixes in priority order: compress and optimize images, upgrade to quality hosting, implement caching, add a CDN, and eliminate render-blocking scripts. Run PageSpeed Insights on your homepage right now — if your mobile score is below 70 or any Core Web Vitals metric is failing, the fixes in this guide will produce measurable improvements in both rankings and conversions.
At Scalify, every website we build is performance-optimized from day one — image compression, quality hosting recommendations, caching configuration, and Core Web Vitals optimization built into the standard delivery process.
Top 5 Sources
Speed Optimization for Different Website Platforms
Webflow
Webflow generates clean, lean code by default and handles much of the basic performance optimization automatically. The main performance levers in Webflow: compress and resize images before uploading (Webflow does not automatically resize images to display dimensions), enable lazy loading on all images below the fold (Webflow's image settings include a lazy load toggle), minimize custom code injections (each third-party script adds load time), and use Webflow's built-in asset hosting which serves files through a CDN. Webflow sites built by experienced developers consistently achieve Lighthouse scores of 85–95 on mobile without additional configuration — the platform's clean output is a genuine performance advantage over plugin-heavy WordPress builds.
WordPress Performance Deep Dive
WordPress performance optimization has a well-established hierarchy of impact. Start with hosting — a slow server cannot be fixed with plugins. Next, implement a caching solution: WP Rocket is the gold standard ($59/year), LiteSpeed Cache is excellent and free on LiteSpeed servers, and Cloudflare's free tier provides CDN caching with minimal configuration. Third, address images: install ShortPixel or Imagify to retroactively compress your entire media library, configure future uploads for automatic optimization, and enable WebP conversion. Fourth, minimize plugins — every active WordPress plugin adds PHP execution overhead, database queries, and potentially frontend scripts. Deactivate and delete any plugin not actively providing value. Fifth, update PHP to the latest stable version (8.2 or 8.3 in 2026) — PHP 8.x is substantially faster than PHP 7.x for WordPress execution. Following this hierarchy in order produces the most improvement per hour of optimization work.
Shopify Performance
Shopify is a hosted platform so server performance is managed by Shopify — but theme code quality and app usage significantly affect front-end performance. The primary Shopify performance optimizations: choose a well-coded theme (Shopify's Dawn theme is performance-optimized), minimize installed apps (each Shopify app typically injects scripts that load on every page), use Shopify's native image optimization rather than uploading oversized images, and implement lazy loading for product images on collection pages. Shopify's Online Store 2.0 themes and the new sections-everywhere architecture are significantly more performant than older theme structures — if you're on a legacy Shopify theme, migrating to a modern theme often produces large performance improvements before any other optimization.
Third-Party Scripts: The Hidden Speed Killers
Third-party scripts — Google Analytics, Facebook Pixel, live chat widgets, heatmap tools, A/B testing platforms, social media embeds, advertising pixels — are often the largest contributors to slow page load times on otherwise well-optimized websites. Each script requires a separate DNS lookup, connection, and download, and executes JavaScript that competes for the browser's main thread with the code that renders your content.
Script CategoryTypical Load Time ImpactOptimization ApproachGoogle Analytics 450–100msLoad async; use Google Tag Manager for all tagsFacebook Pixel100–200msLoad async; consider server-side events API to remove browser pixelLive chat (Intercom, Drift, etc.)300–800msDefer until user interaction or scroll; lazy load widgetHeatmap tools (Hotjar, Microsoft Clarity)200–500msLoad on scroll or interaction; disable on mobileSocial share buttons200–600ms per platformUse privacy-friendly alternatives that don't load external scripts until clickedFont providers (Google Fonts)100–300msSelf-host fonts or preconnect to fonts.gstatic.comVideo embeds (YouTube, Vimeo)400–1,200msUse facade/poster image; only load player on click
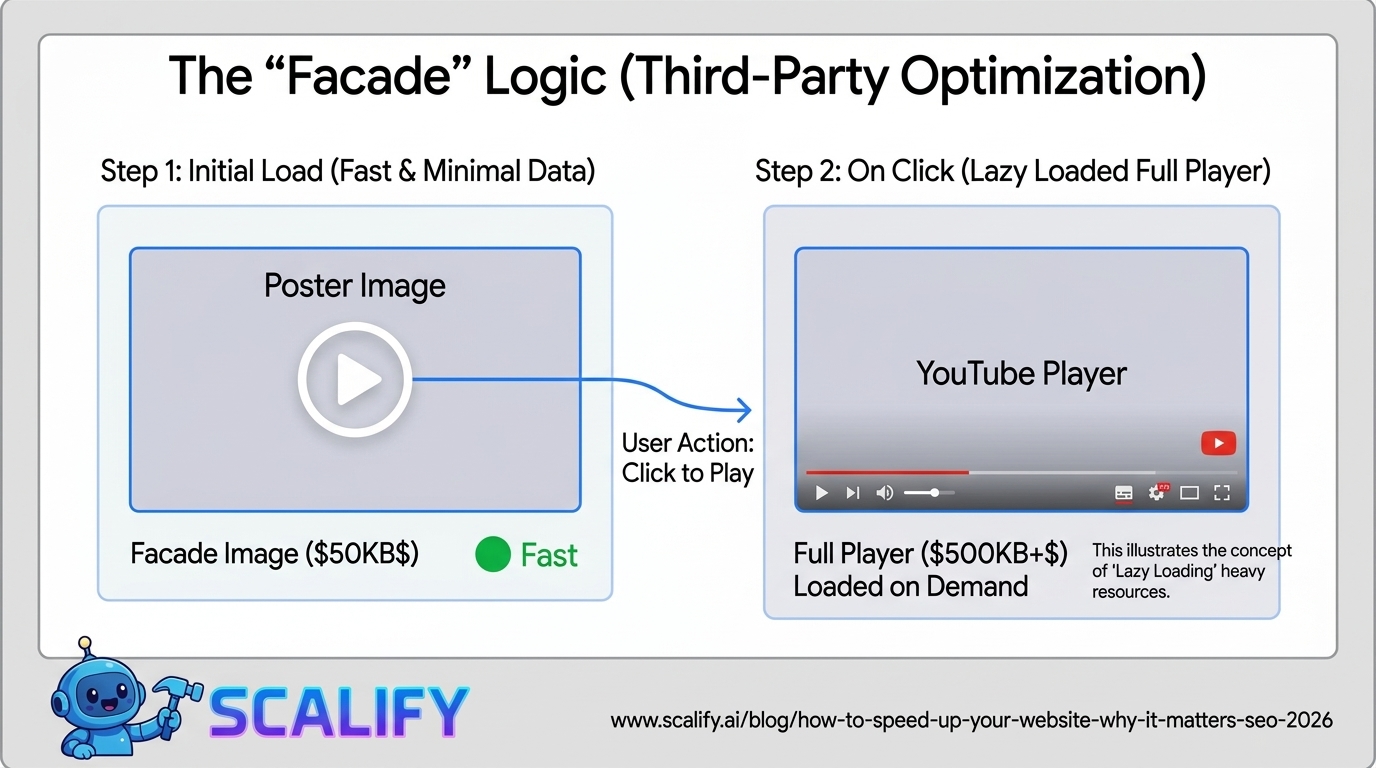
The YouTube embed facade pattern deserves specific attention because embedded YouTube videos are one of the most common causes of failing Core Web Vitals on content-heavy websites. A standard YouTube iframe loads 14 additional requests and adds 500KB+ to page weight, contributing significantly to LCP and overall load time. The facade pattern loads only a poster image initially, displaying a play button overlay — the actual YouTube player only loads when a visitor clicks play. Lite-YouTube-Embed (a web component) or similar libraries implement this pattern with minimal code and consistently produce 20–40% load time improvements on pages with embedded videos.
Monitoring: Keeping Speed Gains Over Time
Page speed is not a one-time fix — it degrades over time as new images are uploaded without optimization, new plugins are installed, third-party scripts are added, and content grows. The businesses that maintain fast websites treat performance as an ongoing operational discipline rather than a project that gets done once.
Minimum monitoring setup: Google Search Console's Core Web Vitals report reviewed monthly (shows real user data across all pages), PageSpeed Insights run on homepage and key landing pages quarterly, and an alert configured in Search Console to notify when Core Web Vitals status changes from "Good" to "Needs Improvement." More sophisticated monitoring uses tools like SpeedCurve or Calibre to track performance on a daily or weekly schedule, catching regressions before they compound into serious ranking or conversion problems. Any development team that regularly deploys code changes to a production website should include Lighthouse performance testing in their CI/CD pipeline — catching performance regressions at the pull request stage rather than after they've already affected real user experience and search rankings.
The ROI Calculation: Is Speed Worth the Investment?
For any website with meaningful traffic and a clear conversion goal, the ROI of speed optimization is straightforward to calculate. Take your current monthly conversion rate, multiply by monthly visitors to get current conversions, then model the improvement: a 2-second improvement in load time on a site currently loading in 5 seconds typically produces a 15–20% conversion rate improvement based on the research data. For a website with 10,000 monthly visitors, a 2% current conversion rate (200 conversions/month), and an average conversion value of $500 — a 15% conversion improvement produces 30 additional conversions per month at $500 each = $15,000 in additional monthly revenue. Speed optimization that costs $2,000–$5,000 to implement pays back in 1–4 months and continues generating that improvement indefinitely.


.jpeg)


78 SW 7th St, Miami, FL 33130


