


How Many People Use Ad Blockers? Impact on Website Revenue (2026)
By Josh Ternyak

April 18, 2026
912 million people use ad blockers globally, causing $54 billion in lost revenue. This comprehensive guide covers usage rates by industry, revenue impact calculations, why people install blockers, Acceptable Ads program, how publishers are adapting (subscriptions, native advertising, email), mobile ad blocking dynamics, measuring your specific block rate, content gates, native advertising as an alternative, the future of ad blocking, and the underlying user trust relationship.
How Many People Use Ad Blockers? Impact on Website Revenue (2026)
Ad blockers have quietly become one of the most significant structural challenges in digital advertising — not because they're a new problem, but because their adoption has grown substantially while publishers and advertisers have only partially adapted. In 2026, over 912 million people globally use some form of ad blocking, and the revenue impact on ad-supported websites runs into tens of billions of dollars annually. Understanding who uses ad blockers, why, and how websites can adapt is essential knowledge for any publisher or marketer making decisions about monetization strategy.
Key Ad Blocker Statistics for 2026
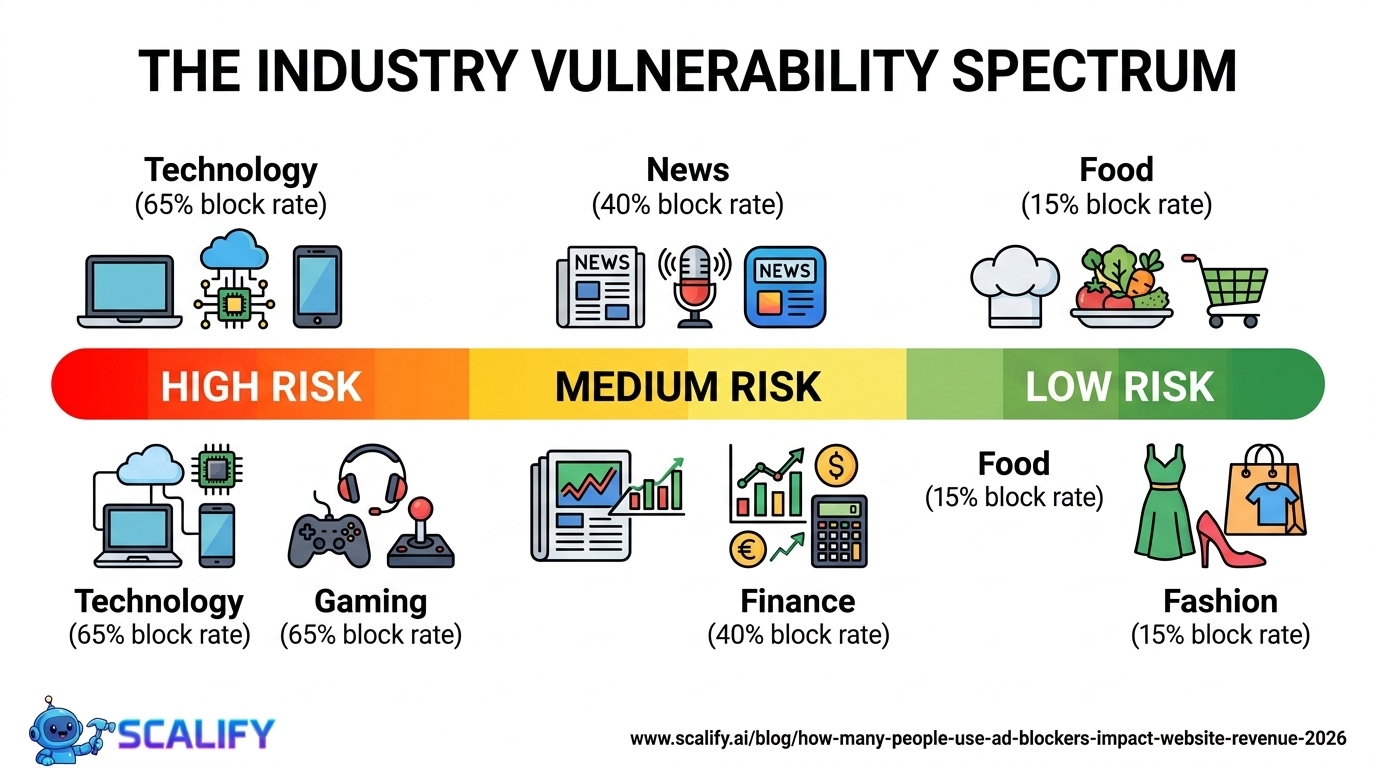
Ad Blocker Usage by Industry
Industry/Content TypeTypical Ad Block RatePrimary User DemographicTechnology / Developer sites45–65%Tech-savvy developers and engineersGaming websites and forums40–60%Young males, early adoptersNews and media30–45%Informed digital-native readersSoftware downloads / reviews40–55%Technical users researching toolsFinance and investing25–40%Higher income, privacy-consciousEntertainment and streaming20–35%Mixed demographicsE-commerce retail15–25%Mixed demographicsFood and recipe sites10–18%Often older, less tech-savvyFashion and beauty12–20%Skews female, mobile-heavyLocal news / regional sites20–35%Varies by market demographics
The Revenue Impact on Different Site Types
The financial impact of ad blocking varies dramatically by monetization model and audience composition. For a technology blog with 45% ad blocker usage and $10 CPM ad rates:
MetricWithout Ad BlockersWith 45% Ad BlockingRevenue LossMonthly pageviews500,000500,000—Ad-viewable pageviews500,000275,000 (55% who don't block)225,000 pageviewsMonthly ad revenue ($10 CPM)$5,000$2,750-$2,250/monthAnnual revenue loss——-$27,000/year
For a tech site with 60% ad blocking, the losses are even more severe — losing more than half of potential ad revenue to blocked impressions. At scale, these numbers are devastating for ad-supported business models that depend on consistent CPM revenue to fund content creation.
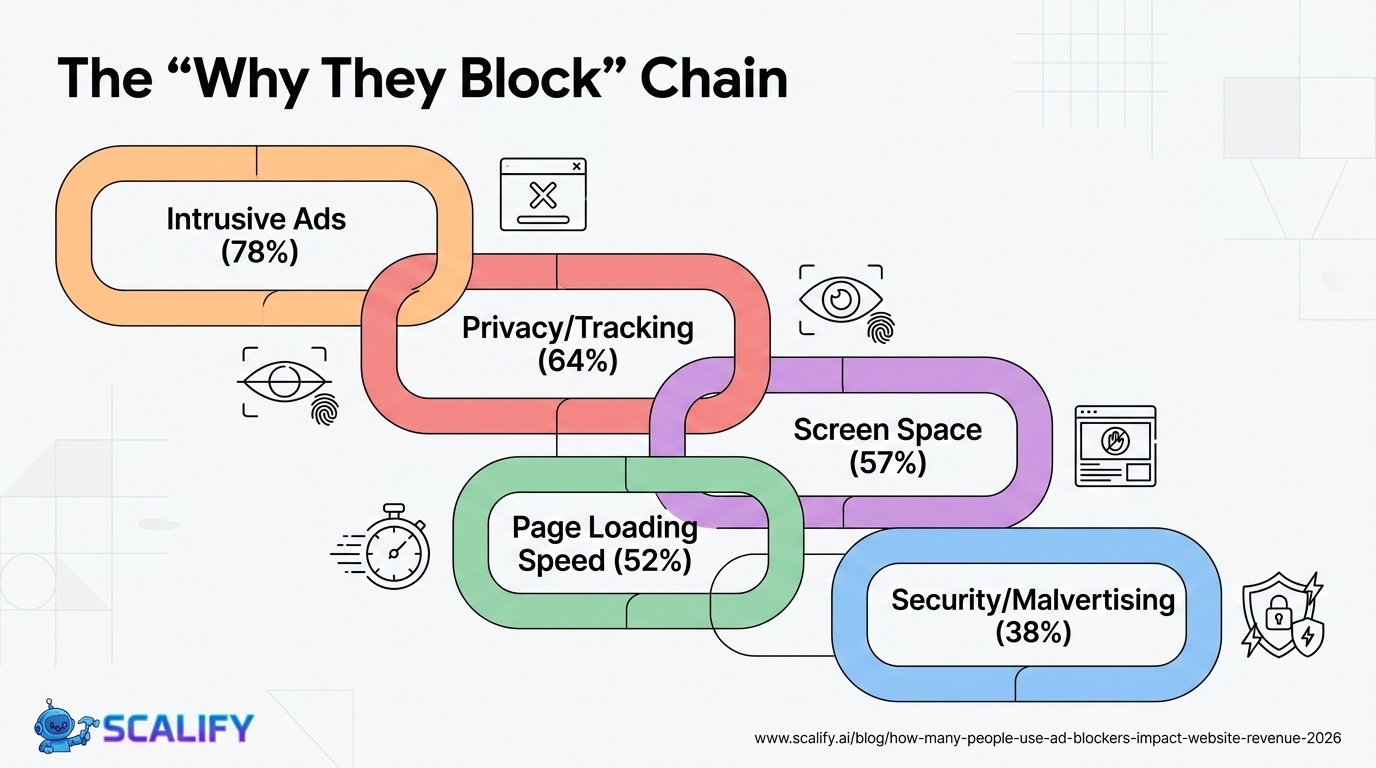
Why People Use Ad Blockers
Reason% of Ad Blocker Users CitingBusiness ImplicationAds too intrusive / disruptive78%Better ad experiences could reduce installation motivationPrivacy / tracking concerns64%Growing concern — harder to address without fundamental changesAds take up too much space57%Less intrusive formats reduce blocking motivationAds slow down page loading52%Faster, lighter ad implementations reduce this concernAnnoying or irrelevant ads48%Better targeting and quality control helpsSecurity concerns (malvertising)38%Ad network security failures drive legitimate concernAlready used it before installing this browser20%Habit — less addressable by individual publishers
Acceptable Ads: The Industry's Compromise
Eyeo (the company behind AdBlock Plus) pioneered the "Acceptable Ads" initiative — a whitelist of advertising that meets specific criteria for being non-intrusive enough to allow through ad blocking. The criteria: ads must be clearly distinguishable from content, can't be animated, must be text-based or static images with limited size, can't occupy more than 25% of a page, and can't be placed in front of content. Publishers and ad networks that comply with these criteria can apply to have their ads whitelisted — reaching the 15–20% of ad blocker users who use the Acceptable Ads whitelist.
Google pays Eyeo to be on the Acceptable Ads whitelist — a commercial arrangement that some publishers and privacy advocates view as controversial. Regardless of the business dynamics, the Acceptable Ads program represents the ad industry's clearest articulation of what advertising looks like when it's designed to be tolerable rather than maximally monetizing.
.jpeg)
How Publishers Are Adapting to Ad Blocking
StrategyEffectivenessImplementation ComplexityRevenue Recovery PotentialAnti-ad-blocker walls (block content unless ads enabled)Low — high user abandonmentLowLow — mostly drives traffic awayAcceptable Ads complianceMedium — reaches ~15% of blockersLowMedium — partial recoverySubscription / paywall modelsHigh for quality content publishersMediumHigh — converts small % to paidNative advertising / sponsored contentHigh — bypasses most blockersMediumHigh — often higher CPM than displayEmail newslettersHigh — ad-free reader environmentLowHigh if list is large enoughAffiliate marketing (non-ad-based)High — bypasses ad blockers entirelyLowVariable — depends on content relevanceDirect advertising dealsVery High — custom placementsHigh — requires sales teamVery High but requires scale
Ad Blocking on Mobile: Different Dynamics
Mobile ad blocking operates differently from desktop. Browser-based ad blockers require users to install browser extensions — easy on desktop Chrome, less common on mobile where browser extensions are limited (especially on iOS). However, iOS users can install content blockers through the App Store (AdGuard, 1Blocker) that block ads at the DNS level, affecting all apps and browsers simultaneously. On Android, similar DNS-level blocking tools work system-wide. The lower mobile ad block rate (15–18%) vs desktop (38%) has historically protected mobile advertising revenues, but DNS-level blocking tools are growing in adoption among privacy-conscious mobile users.
The Privacy Regulation Connection
Ad blocking growth is closely connected to the growing movement for stronger privacy protections — GDPR in Europe, CCPA in California, and similar regulations globally. These regulations require explicit consent for tracking cookies, and the resulting consent banners have paradoxically increased ad blocker installation: users who see a consent banner asking permission to track them across the web are more likely to install an ad blocker if they weren't already using one. The combination of growing privacy awareness, tracking-as-default advertising infrastructure, and regulatory pressure is creating sustained growth in ad blocker adoption that individual publishers have limited ability to counteract.
Strategies for Ad-Supported Websites
For publishers who depend on advertising revenue and face significant ad blocking, the most viable adaptation strategies are: diversify beyond display advertising toward native content, sponsorships, and affiliate programs that bypass ad blockers; build direct subscriber relationships through email lists that provide ad-free revenue streams independent of on-site ad performance; experiment with subscription models that reward a portion of readers for paying to support content; and improve the quality and user experience of ads shown to non-blocking visitors, reducing future ad blocking motivation. Publishers who invest in audience relationships — email subscribers, community members, loyal readers — build revenue resilience that pure display advertising cannot provide.
The Bottom Line
Ad blockers affect 27% of US internet users and up to 65% of visitors on technology and gaming sites. The $54 billion annual revenue impact has forced publishers to diversify monetization strategies — toward native advertising, subscriptions, email newsletters, and affiliate marketing that bypass ad blocking entirely. For websites monetized through advertising, understanding your specific audience's ad blocking rate (measurable through server-side analytics vs. client-side) and diversifying monetization accordingly is essential strategic planning in 2026's ad-blocked web.
At Scalify, we build professional websites optimized for performance — and help clients think through monetization architecture that's resilient to the realities of the modern ad-blocked web.
Top 5 Sources
Measuring Ad Blocking on Your Website
Most analytics platforms don't accurately measure ad blocking because ad blockers often also block analytics tracking scripts. Google Analytics, for example, is blocked by many ad blockers — meaning sites that rely solely on GA for analytics are missing not just the ad revenue from blocked ads but also the ability to accurately measure how much blocking is happening. The most accurate way to measure your site's actual ad blocking rate is through server-side analytics (Cloudflare Analytics, Plausible, server logs) that can't be blocked by browser extensions, compared against client-side Google Analytics numbers. The gap between server-side visitor counts and GA visitor counts represents your approximate ad blocking rate. For most tech-adjacent sites, this gap will be substantial — often 30–50%.
Content Gates and Subscriber Walls: The Anti-Ad-Blocker Approach
Some publishers have implemented "acceptable ad" gates that detect ad blockers and ask visitors to either disable the ad blocker for this site or subscribe to an ad-free version. The results are mixed: a portion of visitors comply (particularly on sites where the content is genuinely valuable and differentiated), but the majority abandon the site rather than disabling their ad blocker for a site they're visiting for the first time. The publishers who see the best results from content gates are those with genuinely must-read content — specialized news, research, or niche content that has no free alternatives — where the trade-off between blocking-disable friction and losing access to content clearly favors disabling the blocker.
The "subscribe to see this content" approach is more sustainable than the gate approach for high-quality publishers. Major news publishers (New York Times, The Guardian, The Atlantic) have successfully built subscriber bases partly from ad-blocking audiences who prefer paying for an ad-free experience over being locked out of content. For smaller publishers, the economics of subscription infrastructure may not make sense until visitor volume is sufficient to generate meaningful subscription revenue — typically requiring at minimum 50,000–100,000 monthly unique visitors before subscription overhead is justified.
Native Advertising: The Ad Blocker-Resistant Alternative
Native advertising — sponsored content, branded articles, sponsored newsletters — bypasses ad blockers because it's built into the editorial content rather than delivered through ad networks that ad blockers target. Native advertising rates are also typically higher than display rates because the format is less disruptive and more trusted — sponsored content that provides genuine value to readers performs significantly better than display ads for brand recall and conversion. Publishers who diversify toward native advertising reduce their ad-blocking exposure while often improving their revenue per reader — capturing value from audiences that ad-blocking has made effectively inaccessible through traditional display advertising.
The Future of Ad Blocking
Ad blocking is likely to continue growing as privacy awareness increases and tracking-based advertising becomes less socially acceptable. The technical infrastructure for ad blocking has matured — browser extension ad blockers are now mainstream, DNS-level blocking is growing on mobile, and privacy-focused browsers (Brave, Firefox) include ad blocking by default. The advertising industry's response — through the Acceptable Ads program, Privacy Sandbox (Google's post-cookie tracking alternative), and publisher diversification into subscriptions and native advertising — is an ongoing adaptation process rather than a solved problem. For publishers, building audience relationships that extend beyond ad-supported page views — through email subscribers, community members, and direct subscriber relationships — is the most resilient long-term adaptation to the ad-blocked web.
Ad Blocking and User Trust: The Underlying Relationship Problem
At its core, the ad blocking phenomenon reflects a trust deficit between website publishers and their audiences. Users install ad blockers not primarily to harm publishers financially but to protect themselves from practices they find intrusive, privacy-violating, or deceptive. The ad industry — through auto-playing video ads, pop-up interstitials, countdown timers on skippable ads, and pervasive cross-site tracking — created the adversarial relationship that made ad blockers not just acceptable but desirable to large portions of the internet audience. Publishers who create genuine value for their audiences, respect reader attention with non-intrusive ad placements, and are transparent about their monetization earn more goodwill and less ad blocking than those who squeeze maximum short-term revenue from every visitor.
This trust framework suggests that the most effective long-term response to ad blocking is not technical countermeasures but audience relationship building — creating content valuable enough that readers choose to support it, advertising experiences respectful enough that readers don't feel the need to block them, and subscription options compelling enough that readers pay for the ad-free experience. Publishers who build this relationship consistency earn the audience loyalty that sustains ad-supported businesses even in a world where ad blocking continues growing.


.jpeg)

.jpeg)


78 SW 7th St, Miami, FL 33130


