


Pop-Up Statistics: Do They Actually Work? (2026 Data)
By Josh Ternyak

April 17, 2026
Comprehensive 2026 guide: Pop-Up Statistics: Do They Actually Work? (2026 Data)
Key Statistics: Website Pop-Ups
The Pop-Up Paradox: Hated But Effective
Pop-ups occupy a unique and uncomfortable position in web marketing: they're one of the most disliked features a website can have, and simultaneously one of the most effective tools for email list growth, lead capture, and offer promotion. Understanding this paradox requires separating the "pop-up" category into its components — because "pop-up" covers everything from intrusive full-screen overlays that appear immediately on page load to carefully timed, contextually relevant exit-intent messages that catch visitors at the exact moment they're about to leave.
The research consistently shows that bad pop-ups destroy user experience and good pop-ups build email lists, recover abandoning visitors, and drive revenue at rates that justify their continued widespread use. The distinction between those categories is the substance of this guide.
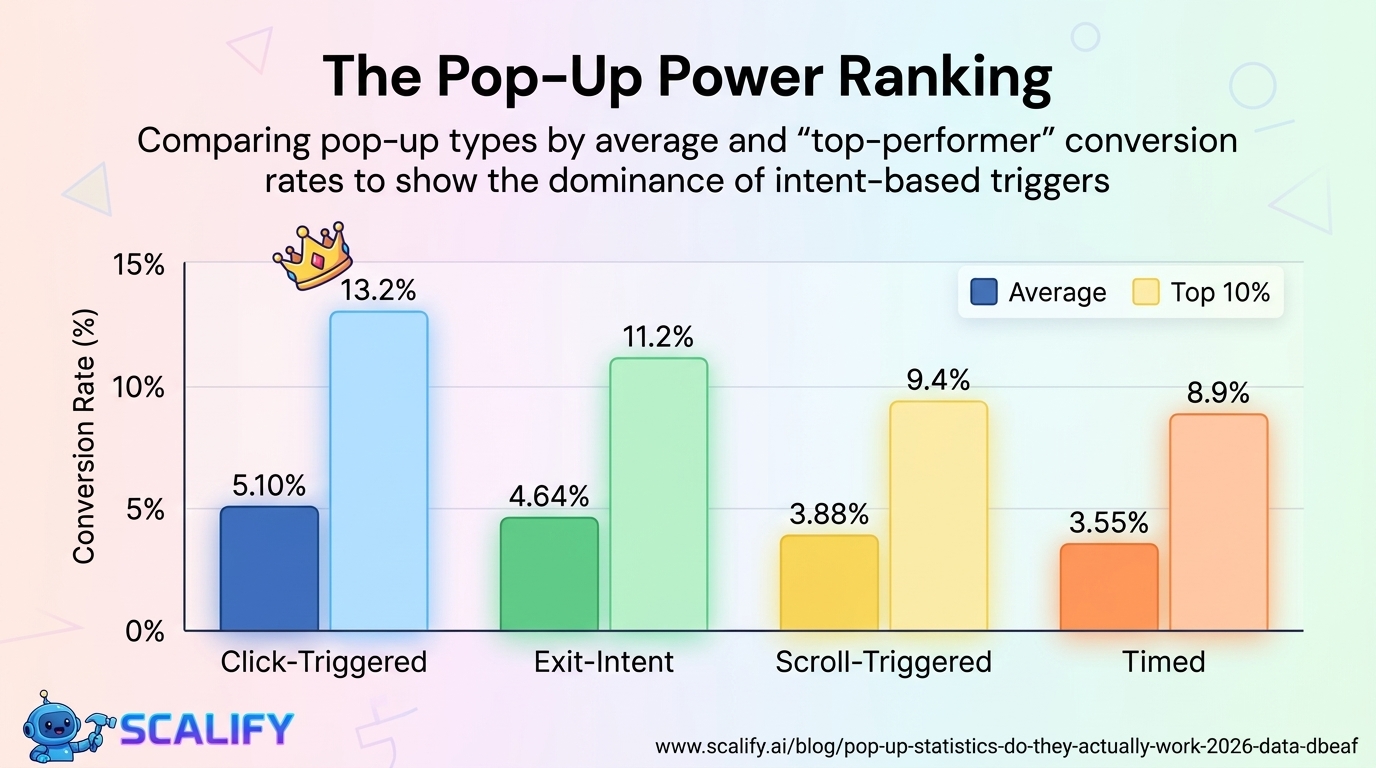
Pop-Up Conversion Rates by Type
Pop-Up TypeAverage Conversion RateTop 10%Primary Use CaseExit-Intent Pop-Up4.64%11.2%Recover abandoning visitors, capture emailsScroll-Triggered (50–75% scroll)3.88%9.4%Engaged reader capture, content upgradesTimed Pop-Up (8–30 sec delay)3.55%8.9%General email capture, offersClick-Triggered (CTA → pop-up)5.10%13.2%Intent-based capture, highest qualityWelcome Mat (full-page overlay)2.18%5.8%High-value offer presentationImmediate Pop-Up (on load)1.42%4.1%Generally not recommendedSticky Bar / Banner1.94%5.2%Persistent but non-intrusiveSlide-In (corner)2.87%7.1%Less intrusive email capture
Click-triggered pop-ups (5.10% average) consistently outperform all other pop-up types because they're the only type where the visitor has explicitly indicated interest before the pop-up appears. Clicking a "Get the Free Guide" button and seeing a one-field email capture form is a fundamentally different experience than having a pop-up interrupt unsolicited reading. The act of clicking creates consent and intent, which is why click-triggered pop-ups produce both higher conversion rates and better email list quality (subscribers who clicked a specific CTA have higher engagement and lower unsubscribe rates than those captured by interruption pop-ups).
.jpeg)
Pop-Up Timing: When to Show Matters Enormously
Timing of Pop-UpAverage Conversion RateUser Experience ImpactImmediately on page load (0 sec)1.42%Most negative — visitor hasn't seen content yetAfter 4 seconds2.38%Negative — still very earlyAfter 8 seconds3.72%Neutral — visitor has had some engagement timeAfter 15 seconds4.11%Positive — demonstrates clear interest in contentAfter 30 seconds3.95%Positive — high engagement signalAfter 50% scroll3.88%Positive — behavior-triggeredAfter 75% scroll4.54%Very positive — deep engagement signalOn exit intent4.64%Neutral to positive — visitor was leaving anyway
The timing data makes a compelling case: waiting at least 8 seconds before showing a pop-up improves conversion rates by 37% compared to immediate pop-ups, and dramatically improves user experience. Visitors who have spent 15+ seconds on a page or scrolled 75%+ through the content have demonstrated clear engagement — they're primed for a relevant offer in a way that someone who just arrived 2 seconds ago is not.
The exit-intent timing deserves special emphasis. When a visitor's mouse moves toward the browser's close button or back button, exit-intent technology triggers a pop-up at the last possible moment before they leave. This timing is uniquely defensible from a user experience perspective — the visitor was leaving regardless. If the pop-up offer is compelling enough to stop them, it has added value for both parties. If it isn't compelling enough, they close it and leave — exactly what they were going to do anyway.
Pop-Up Design: What Elements Drive Conversion
Design ElementConversion ImpactNotesOne form field (email only) vs. 3+ fields+200 – 300% increaseMost impactful single factorCountdown timer present+9.4% average liftUrgency principlePersonalization (name, page context)+110% lift vs. genericRequires visitor data or segmentationSpecific offer headline vs. generic+38% lift"Get 20% off your first order" vs. "Sign up"Yes/No options (declining the offer)+2 – 5% conversion lift"No thanks, I don't want 20% off"Close button visibility (clearly visible)Better UX, similar conversionCounterintuitively, easier close = more trustImage included+15 – 22% vs. text-onlyVisual representation of the offerSocial proof ("Join 12,000 readers")+12 – 18% liftFOMO and validation
The one-field form effect is the most dramatic design finding in pop-up optimization research. Reducing a pop-up from three fields (first name, last name, email) to one field (email only) typically triples conversion rates. The psychological friction of each additional form field is disproportionate to the actual time it takes to fill in — each field represents a decision point, a reason to abandon, and an increase in the perceived "cost" of the conversion. Unless the additional information is genuinely essential to delivering value to the subscriber, every field beyond email address is a conversion killer.
Exit-Intent Pop-Up Statistics: The Abandonment Recovery Tool
Exit-Intent MetricDataAverage conversion rate (email capture)4.64%E-commerce cart abandonment recovery rate10–15% of abandoning visitorsAverage revenue recovered per 1,000 exiting visitors$17 (e-commerce avg)% of visitors who engage with exit-intent offer~35%Average order value increase when exit-intent discount used+8.4% (discount FOMO effect)Best offer type for e-commerce exit-intentDiscount code (37% conversion) vs. free shipping (28%)Best offer type for content site exit-intentContent upgrade / guide (42% conversion)
Exit-intent pop-ups for e-commerce deserves its own analysis because the conversion mechanics are different from general email capture. A visitor adding items to a cart and then moving to exit is at a specific decision point — they're interested enough to have shopped, but something (price, uncertainty, distraction) prevented completion. An exit-intent pop-up offering a discount code at this exact moment is addressing the most likely objection (price) at the highest-intent moment. The 10–15% recovery rate means that for every 100 visitors who were about to abandon a cart, 10–15 are persuaded to complete the purchase — representing significant revenue from traffic that would otherwise be entirely lost.
Pop-Up Copy: What Research Says About Messaging
Copy ElementBest PracticeConversion ImpactHeadlineSpecific benefit, not generic ask+38% for specific vs. genericCTA button textFirst-person, action ("Send me the guide")+14.8% vs. "Submit"Decline option textMake declining seem irrational ("No thanks, I'll pay full price")+2 – 5% conversionValue proposition claritySpecific, quantified where possibleHigh — vague offers underperformSocial proof line"Join 8,400 subscribers"+12–18% when audience is largePrivacy reassuranceOne line below email field+5–8% especially for privacy-conscious segments
The first-person CTA button text finding (+14.8% for "Send me the guide" vs. "Submit") is one of the most replicable micro-copy improvements in conversion rate optimization. The mechanism is simple: "Send me the guide" describes the outcome the visitor is getting and frames the action from their perspective, while "Submit" is a generic technical instruction that communicates nothing about value. The psychological ownership implied by "me" language activates a different response than passive, generic action words.
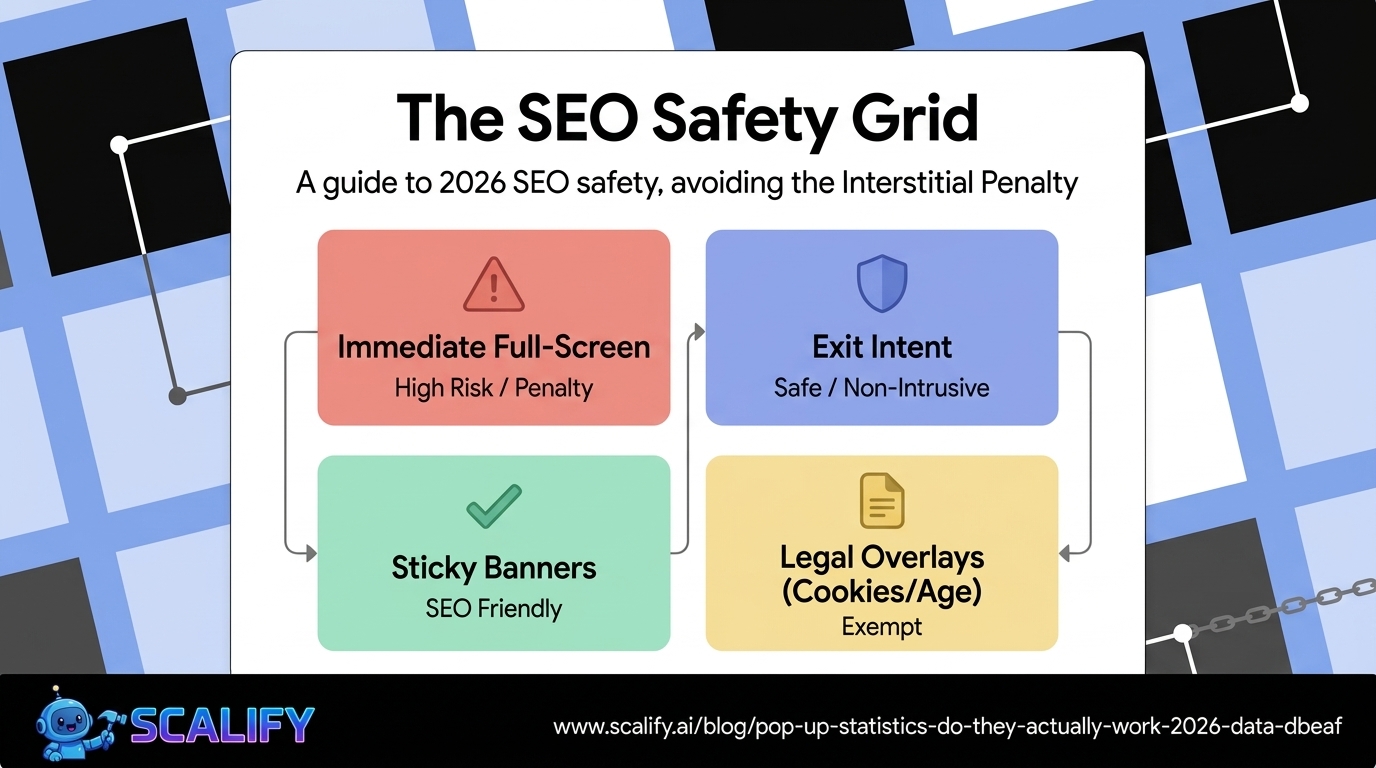
The Google Penalty: Pop-Ups and Mobile SEO
In 2017, Google began penalizing mobile pages with intrusive interstitials (full-screen pop-ups that prevent access to content) under its Mobile Interstitials penalty. Understanding the boundary between penalized and non-penalized pop-ups is essential for websites that depend on organic search traffic:
Pop-Up TypeGoogle Penalty RiskNotesFull-screen pop-up that covers content immediately on loadHigh riskPrimary target of the penaltyExit-intent pop-up (triggered by leaving)Low riskNot typically penalizedScroll-triggered pop-upLow riskBehavior-based, not immediateCookie consent banner (legally required)ExemptLegal compliance exempted by GoogleAge verification overlayExemptLegal requirement exemptionSmall banner/slide-in (doesn't cover main content)No riskBelow-fold or small overlaySticky bottom barNo riskDoesn't cover primary content
Pop-Up Performance by Industry
IndustryAverage Pop-Up Conversion RateBest Pop-Up TypeE-Commerce3.80%Exit-intent discount, cart abandonmentSaaS / Software4.12%Free trial offer, demo bookingContent / Media / Blogs2.94%Content upgrade, newsletterProfessional Services3.21%Free consultation, guide downloadHealthcare / Wellness2.71%Appointment booking, health guideEducation3.88%Free course, email seriesReal Estate3.44%Market report, property alertFood / Restaurant2.18%Discount, event notification
When Pop-Ups Hurt: The Negative Effects
The case for pop-ups isn't unconditional. Research also documents specific scenarios where pop-ups reliably damage business outcomes:
ScenarioNegative OutcomeSourceImmediate pop-up on mobile (covers content)Google SEO ranking demotionGoogle Webmaster GuidelinesPop-up on every page visit (no frequency cap)Higher bounce rates, lower session timeWisepops ResearchPop-up before any content engagement72% close rate without readingNielsen Norman GroupNon-dismissible pop-up (no clear X)87% immediate back button responseUX research, Baymard InstitutePop-up that reappears after dismissalSignificant trust damage, high abandon rateCXL Research
The common thread across all negative pop-up scenarios is disrespect for visitor autonomy — appearing before the visitor has had any chance to see content, reappearing after explicit dismissal, or making it difficult to close the pop-up. These behaviors transform a potentially useful intervention into an adversarial interaction that signals disrespect for the visitor's time and preferences. The pop-ups that perform best are those that feel like a genuinely relevant offer made at the right moment — not a digital ambush.
The Bottom Line: Do Pop-Ups Actually Work?
The data answers clearly: yes, pop-ups work — with significant caveats about type, timing, and implementation. The average 3.09% conversion rate means that a website with 10,000 monthly visitors and a well-implemented email capture pop-up builds a list of 309 new subscribers per month. At typical email marketing ROI ($42 for every $1 invested), that list has substantial long-term commercial value that compounds over time.
The pop-ups that work best share common characteristics: they appear after behavioral signals of engagement (time on page, scroll depth, or exit intent), offer specific and valuable outcomes rather than vague promises, use single-field forms, and make dismissal easy. The pop-ups that damage websites share the opposite characteristics: they appear immediately, offer generic value propositions, require multiple fields, and interrupt rather than enhance the visitor's content experience.
At Scalify, we build websites designed for conversion — including strategic use of pop-up and lead capture elements that follow the research-backed timing and design principles that separate effective list-building from bounce-rate-damaging interruptions.
Top 5 Sources
Key Takeaways and Next Steps
The principles and data in this guide reflect what actually works in professional web development and digital marketing in 2026 — not theoretical best practices but measured, documented outcomes from implementations at scale. The gap between knowing these principles and benefiting from them is always execution: the businesses that act on what they read, implement changes systematically, and measure the results consistently outperform those who consume information without converting it to action.
For any improvement described in this guide, the implementation sequence that produces the best outcomes: assess your current situation against the benchmarks provided, identify the 2–3 highest-impact improvements specific to your situation, implement them with measurement tracking in place, evaluate results after 30–60 days, and plan the next iteration based on what you learned. This cycle — assess, prioritize, implement, measure, iterate — is the operational foundation of continuous improvement that compounds into significant competitive advantage over the 12–24 month horizon.
The compounding returns from consistent web presence investment are not linear: a website that improves slightly each month accumulates to dramatic improvements over a year, and those improvements multiply with each other. Faster load times improve both search rankings and conversion rates simultaneously. Better content attracts backlinks that improve rankings that attract more traffic. More testimonials build trust that improves conversion rates that improve revenue that funds more investment. The interconnected nature of website performance means that each improvement amplifies the value of every other improvement — making the decision to invest consistently, across multiple dimensions simultaneously, the highest-ROI approach to digital marketing available to most businesses.
At Scalify, every website we build reflects these principles — technically optimized, conversion-focused, SEO-ready, and designed to compound in value over time as content, backlinks, and organic authority accumulate on the strong foundation we deliver in 10 business days.


.jpeg)

.jpeg)


78 SW 7th St, Miami, FL 33130


