


Average Website Session Duration by Industry (2026 Benchmarks)
By Josh Ternyak

April 18, 2026
Session duration varies 3-4x across industries — from 30 seconds for utility sites to 5+ minutes for e-learning. This comprehensive guide covers benchmarks by industry, how GA4's engagement time differs from Universal Analytics, engagement rate as a better metric, what actually increases session duration, when short sessions are good news, session duration and SEO signals, reducing bounce rate, accurate measurement considerations, and e-commerce session optimization nuances.
Average Website Session Duration by Industry (2026 Benchmarks)
Website session duration — the average amount of time visitors spend on a site per visit — is one of the most context-dependent metrics in web analytics. A 45-second average session duration is an abysmal sign for a content platform and an excellent sign for a weather app. Understanding whether your site's session duration is healthy requires comparing against the right benchmark: your industry's average, your specific content type, and your defined conversion goal, not a universal standard that doesn't exist.
Key Session Duration Statistics
Average Session Duration by Industry
IndustryAverage Session DurationKey DriverPublishing / Media / News3:30 – 5:00 minLong-form reading; multiple articles per sessionE-Learning / Education3:00 – 5:30 minCourse content; video lessons; deep engagementB2B SaaS / Software2:30 – 4:00 minDocumentation reading; feature evaluationE-Commerce / Retail2:30 – 4:30 minProduct browsing; comparison; review readingHealthcare / Medical2:30 – 4:00 minSymptom research; provider search; condition informationFinancial Services2:00 – 3:30 minRate comparison; account research; applicationReal Estate3:00 – 5:00 minListing browsing; neighborhood research; map explorationProfessional Services2:00 – 3:30 minService evaluation; portfolio review; contactTechnology / Dev Tools2:30 – 4:30 minDocumentation; tutorials; technical evaluationFood / Recipes1:30 – 3:00 minRecipe reading; quick referenceTravel2:30 – 5:00 minDestination research; booking comparisonLocal Business (services)1:30 – 2:30 minQuick information lookup; hours, contact, reviewsGovernment / Public services1:30 – 3:00 minForms; information lookup; deadline checkingUtilities / Tools (calculators, weather)0:30 – 1:30 minQuick task completion; tool usage
Google Analytics 4: How Session Duration Changed
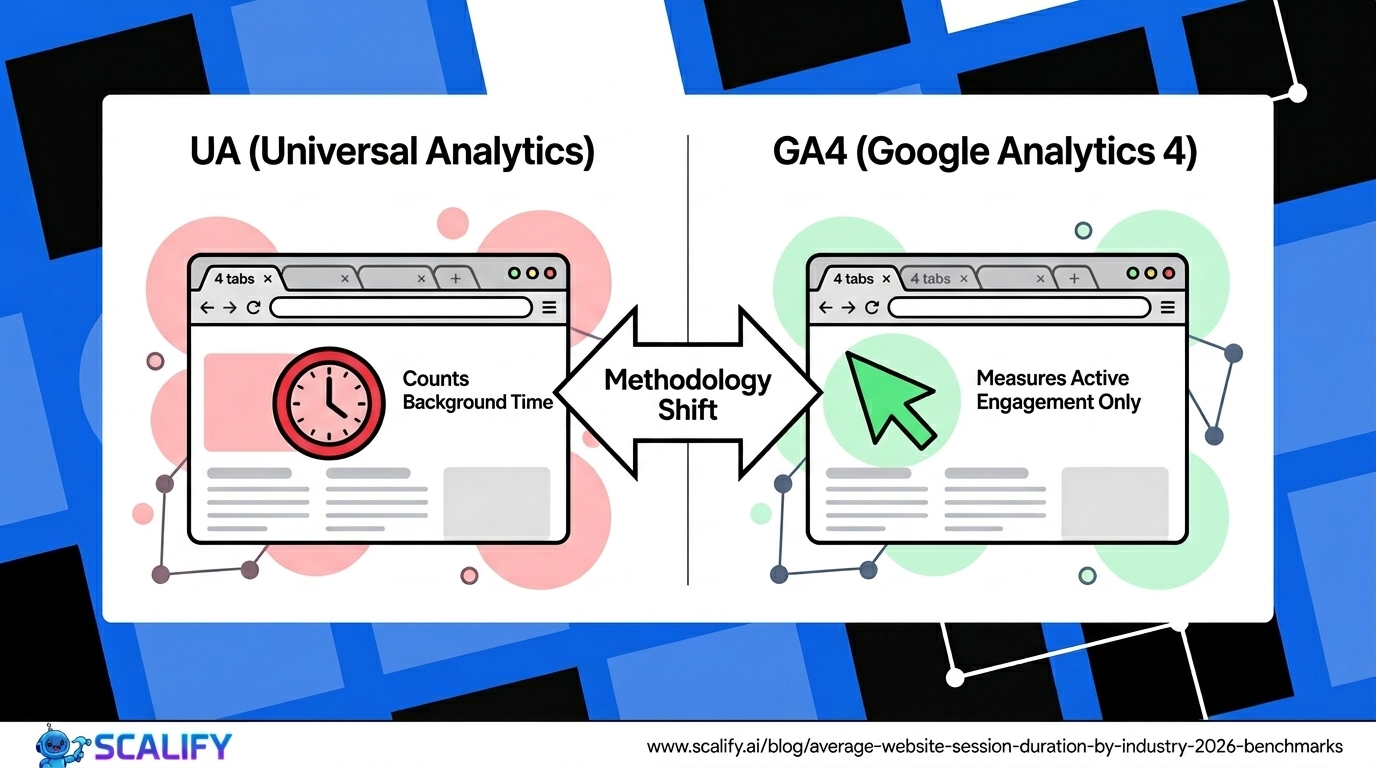
Google Analytics 4 fundamentally changed how time-on-site is measured compared to Universal Analytics (UA). In UA, a user who visits one page and leaves is assigned 0 seconds of session duration (bounce session) — regardless of how long they actually spent reading. In GA4, "Average Engagement Time" measures the time the page is actively in focus in the browser, producing significantly different numbers than UA's session duration.
MetricUniversal AnalyticsGoogle Analytics 4Primary time metricAvg. Session DurationAvg. Session Engagement DurationSingle-page visitsRecorded as 0 seconds (bounce)Records actual active time on pageBackground tabsCounted in time measurementsNot counted — only active foreground timeComparabilityComparable to industry UA benchmarksLower than UA for same site — different methodology
The practical implication: if you've migrated from UA to GA4 and your average session duration appears to have dropped, the difference is largely methodological rather than reflecting actual behavior changes. GA4's engagement time is considered a more accurate measure of actual user attention because it excludes background tabs and actually registers time for single-page visits. Compare your GA4 numbers against GA4 industry benchmarks, not UA benchmarks.
Session Duration vs. Engagement Rate: The Better Metric
Session duration is not the most important engagement metric — it's a secondary indicator that should be interpreted alongside other engagement signals. The more reliable metric for understanding content quality and visitor interest is GA4's Engagement Rate: the percentage of sessions with at least 10 seconds of engagement time, a conversion event, or 2+ pageviews. An engaged session indicates the visit was meaningful; session duration alone can be inflated by long page loads or confused users who can't find what they're looking for.
Industry engagement rate benchmarks in GA4: B2B SaaS and software sites average 55–70% engagement rate; e-commerce sites average 50–65%; content and media sites average 60–75%; local business sites average 45–60%. Low engagement rate (under 40%) combined with short session duration suggests poor content-visitor matching or technical problems. High engagement rate with short session duration can be normal for utility sites where tasks are completed quickly but intent is clearly fulfilled.
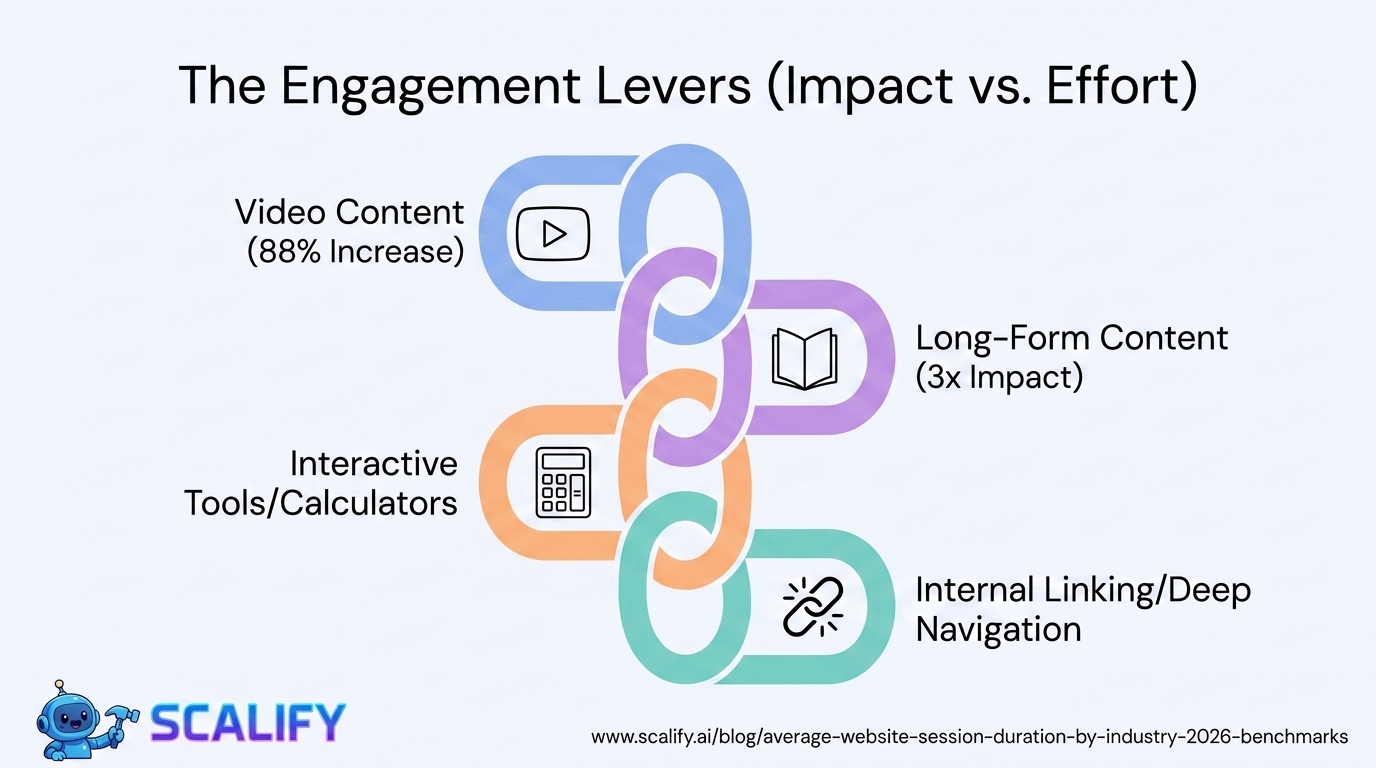
What Actually Increases Session Duration
TacticImpact on Session DurationImplementationVideo contentVery High — 88% longer time on pageEmbed relevant video alongside text contentLong-form, comprehensive contentHigh — 3x vs short contentPublish 2,000+ word articles covering topics fullyInternal links to related contentHigh — increases pages per sessionLink to relevant articles within content; sidebar recommendationsInteractive elements (tools, calculators)High — users spend time using themAdd relevant calculators, quizzes, or configuratorsContent series and multi-part articlesMedium-High — sequential readingLink to "next in series" at end of each articleBetter content-visitor matchingMedium-High — right content to right visitorImprove targeting; better meta descriptions that set expectationsPage load speed improvementMedium — slower loads cause exits before engagementCore Web Vitals optimizationContent recommendations at end of articlesMedium — catches post-read interest"You might also like" sections; related posts
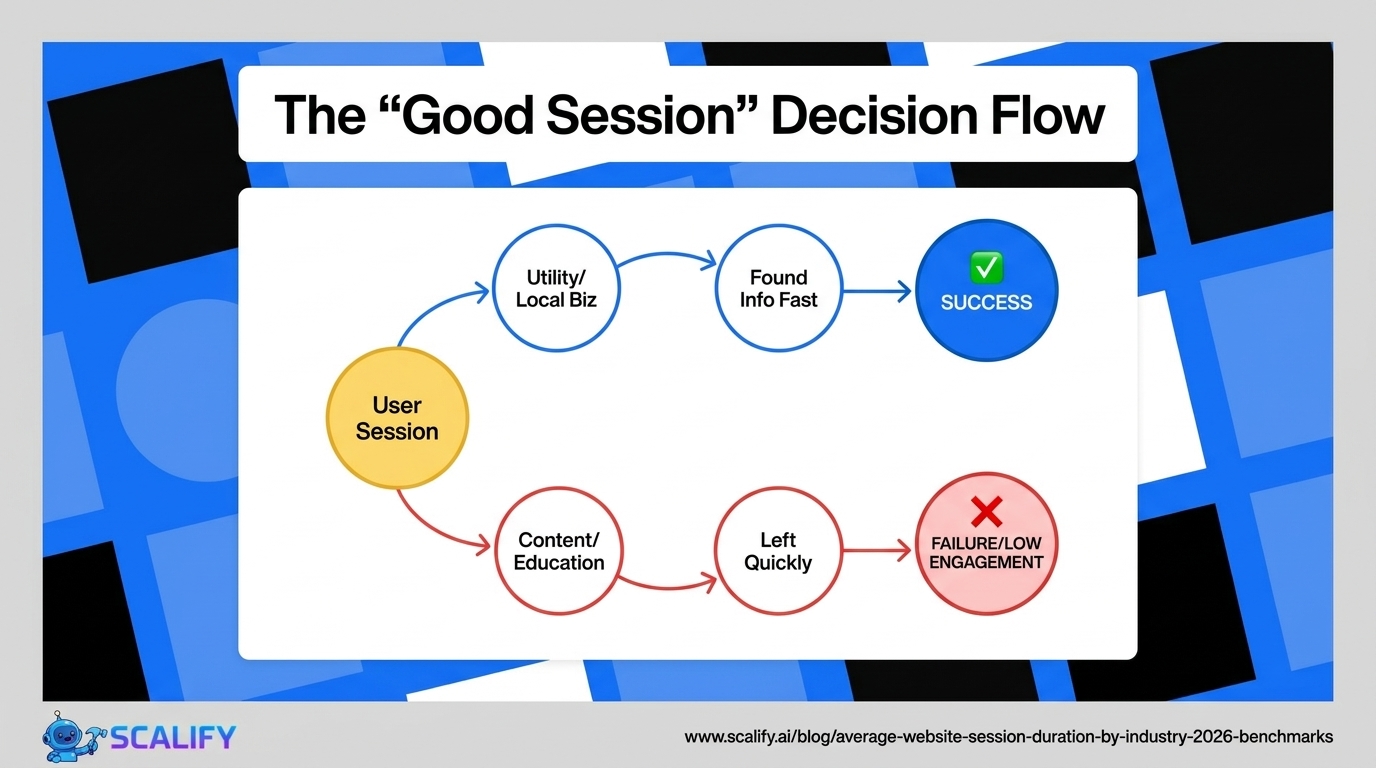
When Short Sessions Are Good News
Not every website should aim for long sessions — and optimizing for session duration on sites where short sessions indicate successful task completion actively misleads the optimization effort. Examples of sites where short sessions are positive signals:
Local business sites. A visitor to a restaurant website who arrives, sees the menu and hours in 90 seconds, and leaves to make a reservation via phone has had a completely successful session. Optimizing this for longer session duration would be misguided — the site successfully served the visitor's need quickly.
E-commerce checkout pages. Visitors who complete checkout in 2 minutes are your best customers — optimizing the checkout experience to be faster (lower session duration) directly improves conversion rate. A slow checkout session is a problem, not a signal of high engagement.
Utility and tool websites. A mortgage calculator, unit converter, or weather site that provides the answer in 30 seconds has served its user perfectly. Longer sessions on utility sites often indicate user confusion or poor UX, not deeper engagement.
The fundamental question is whether session duration aligns with successful task completion. For sites where success requires time (content consumption, product research, documentation reading), longer sessions indicate success. For sites where success means fast task completion, shorter sessions are the goal.
The Bottom Line
Average session duration ranges from 30 seconds for utility websites to 5+ minutes for e-learning and media sites. The universal benchmark of "2 minutes 17 seconds" provides no useful context — compare against your industry's specific norm. GA4's engagement time metric is more accurate than UA's session duration but requires GA4-specific benchmarks for comparison. Focus optimization on increasing engagement rate (meaningful visits) rather than raw session duration — and for utility sites where quick task completion is success, short sessions are a positive signal, not a problem to solve.
At Scalify, we build professional websites designed around the specific engagement goals of each business — whether that's deep content engagement for publishers or efficient task completion for service businesses.
Top 5 Sources
Session Duration and SEO: Does Google Care?
Google uses user engagement signals in its ranking algorithms, but the relationship between session duration and rankings is more complex than "longer sessions = better rankings." Google primarily cares whether searchers who click your result are satisfied with what they found — measured through behavioral signals like pogo-sticking (returning to search results quickly after clicking), CTR relative to position, and whether the user continues searching after visiting your page. Session duration is correlated with these signals but is not a direct ranking factor.
The most important user experience signal for SEO is "long click" vs. "short click" behavior. When a user clicks a search result, spends substantial time on the page, and doesn't return to the search results page, Google interprets this as satisfied user behavior — a positive signal for that page's rankings. When a user clicks and quickly bounces back to search results (pogo-sticking), Google interprets this as failed satisfaction — a negative signal. Session duration is a proxy for this "did the page satisfy the query?" signal, but the relationship is mediated by content relevance: a 30-second session on a utility website that satisfies the user's query completely is better for rankings than a 4-minute session on a confusing page where the user can't find what they need.
Reducing Bounce Rate and Improving Session Depth
Bounce rate — the percentage of visitors who view only one page before leaving — and session depth (pages per session) are related but distinct from session duration. A site can have long session duration with high bounce rate if single-page visits are long (reading a long article without clicking to another page). Or it can have short session duration with low bounce rate if visitors click quickly through multiple pages (quick e-commerce browsing).
The most effective tactics for reducing bounce rate and increasing session depth: strategic internal linking within content (links to related articles at natural reading decision points, not just in sidebars), related content recommendations based on the current page's topic, clear "next step" signposting at the end of content pages, and content series that naturally lead readers from one piece to the next. These tactics work by creating natural reasons for visitors to continue engaging — providing the next relevant piece of content at exactly the moment they've finished the current one.
Measuring Session Duration Accurately
Accurate session duration measurement requires understanding what each analytics platform actually tracks. Key measurement considerations:
GA4 vs. UA measurement. As discussed above, GA4's engagement time differs from UA's session duration methodology. Don't compare GA4 numbers to UA benchmarks.
Bot and spam traffic inflation. Unfiltered analytics data includes bot traffic that can inflate or deflate session duration metrics. Configure GA4 to filter bots, exclude known spam referrers, and verify internal traffic is excluded for the most accurate baseline measurement.
Sampling bias. Analytics sampling (where GA4 analyzes a subset of data rather than all sessions for large sites) can produce session duration estimates that differ from actual full-dataset values. For high-traffic sites, check whether sampling is affecting your engagement metrics and consider GA4's BigQuery export for precise analysis.
Attribution by traffic source. Session duration should be analyzed by traffic source — organic search, email, social, paid — because different sources produce very different session quality. Email newsletter visitors typically engage significantly longer than social traffic; branded organic search converts faster than non-branded. Aggregated session duration hides the source-level insights that drive useful optimization decisions.
Session Duration for E-Commerce: What to Optimize For
E-commerce session duration optimization is more nuanced than for content sites. Longer sessions in e-commerce can mean engaged shoppers browsing multiple products — which is positive. Or they can mean confused shoppers who can't find what they're looking for — which is negative. The distinguishing metric is product page views per session: high product pages per session with long session duration indicates browsing engagement; low product pages with long session duration may indicate navigation confusion. E-commerce sites should optimize for efficient path-to-purchase alongside engagement depth — ensuring that when a visitor arrives with clear purchase intent, the checkout process is frictionless, while also providing enough product discovery and comparison depth for visitors still in research mode. A 4-minute session that ends in purchase is an excellent e-commerce outcome; a 4-minute session that ends in a bounce because the visitor couldn't find the right product is a UX problem to solve regardless of the session duration number.


.jpeg)

.jpeg)


78 SW 7th St, Miami, FL 33130


