


What Is a Good Conversion Rate for a Website? (2026 Benchmarks)
By Josh Ternyak

April 21, 2026
A good website conversion rate is 2-5% for most industries, with top performers hitting 10%+. This comprehensive 2026 guide covers industry benchmarks, conversion rate by traffic source, what defines a conversion, the highest-impact CRO factors, the systematic CRO process, quick wins under 1 week, A/B testing best practices, e-commerce optimization, and B2B vs B2C conversion differences.
What Is a Good Conversion Rate for a Website? (2026 Benchmarks)
Conversion rate is one of the most misunderstood metrics in digital marketing — primarily because "good" is almost entirely context-dependent. A 2% conversion rate is excellent for a high-ticket B2B software platform and catastrophic for an e-commerce site selling $15 products. An 8% conversion rate is outstanding for a professional services firm and mediocre for a simple email capture landing page. Understanding what your website's conversion rate should be requires knowing your industry, your offer, your price point, your traffic quality, and your conversion definition — and comparing against the right benchmark rather than a generic average.
Key Conversion Rate Statistics and Benchmarks
Industry Conversion Rate Benchmarks
IndustryAverage CVRTop QuartileWhat "Conversion" MeansE-Commerce (all products)1.5–2.5%4–6%Completed purchaseE-Commerce (luxury/high-ticket)0.5–1.5%2–3%Completed purchaseSaaS (free trial)2–5%7–12%Free trial signupB2B Lead Gen (contact form)2–5%6–10%Form submissionProfessional Services3–8%10–15%Consultation requestReal Estate2–4%5–8%Lead form / inquiryHealthcare (appointments)3–6%8–12%Appointment bookingLegal Services4–8%10–15%Consultation requestEducation / Courses1–3%4–7%Purchase or enrollmentFinancial Services5–10%12–20%Lead capture / account open
What Defines a "Conversion" — Getting the Definition Right
Before benchmarking your conversion rate, you need to be precise about what you're measuring. The same website might have multiple valid conversion definitions that produce very different rates:
Conversion TypeTypical RateWhat It MeasuresMacro conversion (primary goal)0.5–8%Purchase, form submit, trial signup — the main business outcomeMicro conversion (engagement)5–30%Email subscribe, video view, page scroll depth — steps toward the goalClick-through (CTA)2–20%Clicking a specific button or linkForm completion rate20–50%Completed form vs. form start — measures form friction specificallyAdd to cart (e-commerce)5–15%Intent to buy — separate from completed purchaseCart completion rate25–45%Completed checkout of those who added to cart
Factors That Affect Conversion Rate (And Which Ones Matter Most)
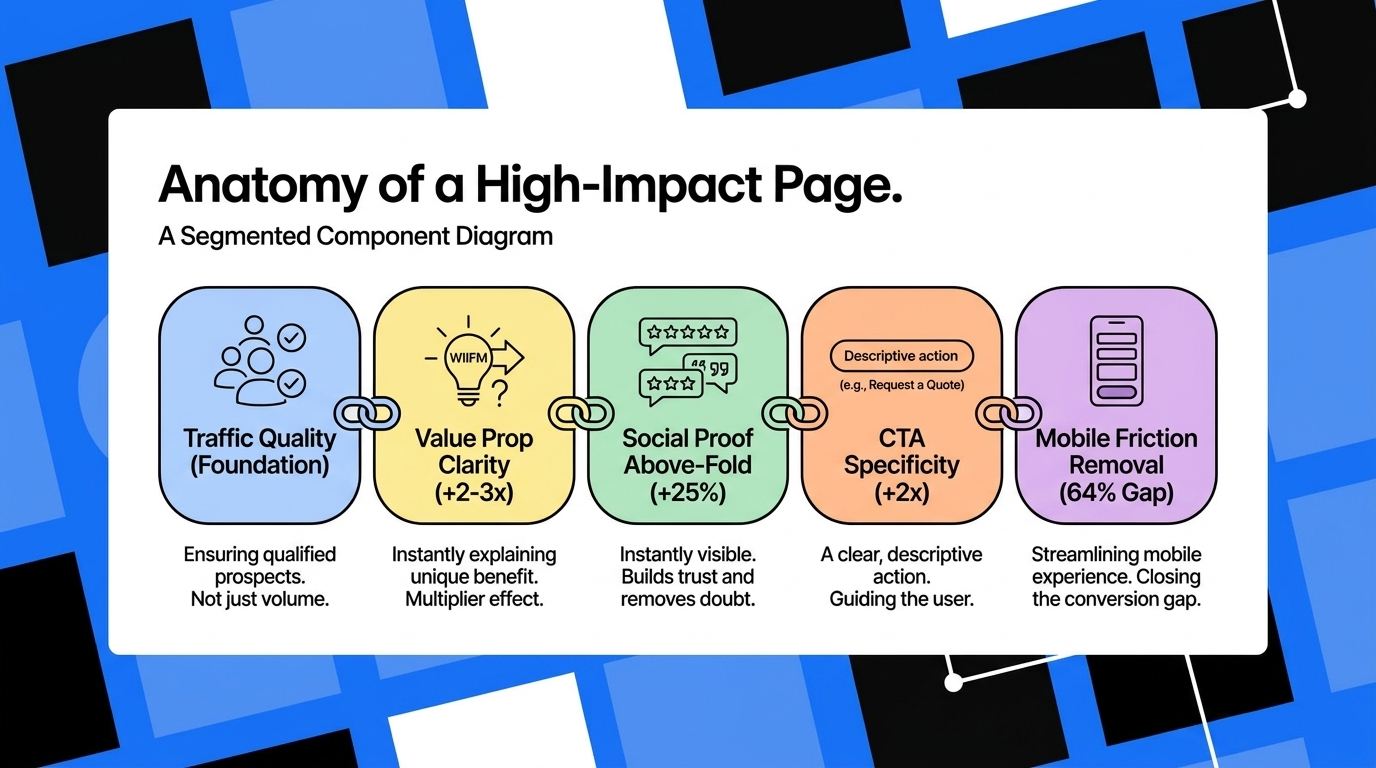
FactorAverage Impact on CVRDifficulty to FixPriorityTraffic quality (matching offer to audience)Very High — can be 2–5x differenceMediumCritical — fix before other CROPage load speedHigh — 7% per second of delayMediumVery HighCTA clarity and prominenceHigh — up to 2xLowVery HighSocial proof (reviews, testimonials)High — +34% averageLow-MediumHighValue proposition clarityVery High — often 2–3xMedium-HighCriticalMobile optimizationHigh — 64% mobile CVR gapMediumVery HighForm length reductionMedium-High — shorter = more submissionsLowHighTrust badges / security signalsMedium — +11–15%LowMediumLive chat availabilityMedium-High — +20–31%MediumHighColor / visual designLow — rarely more than 5–8%HighLow — other factors first
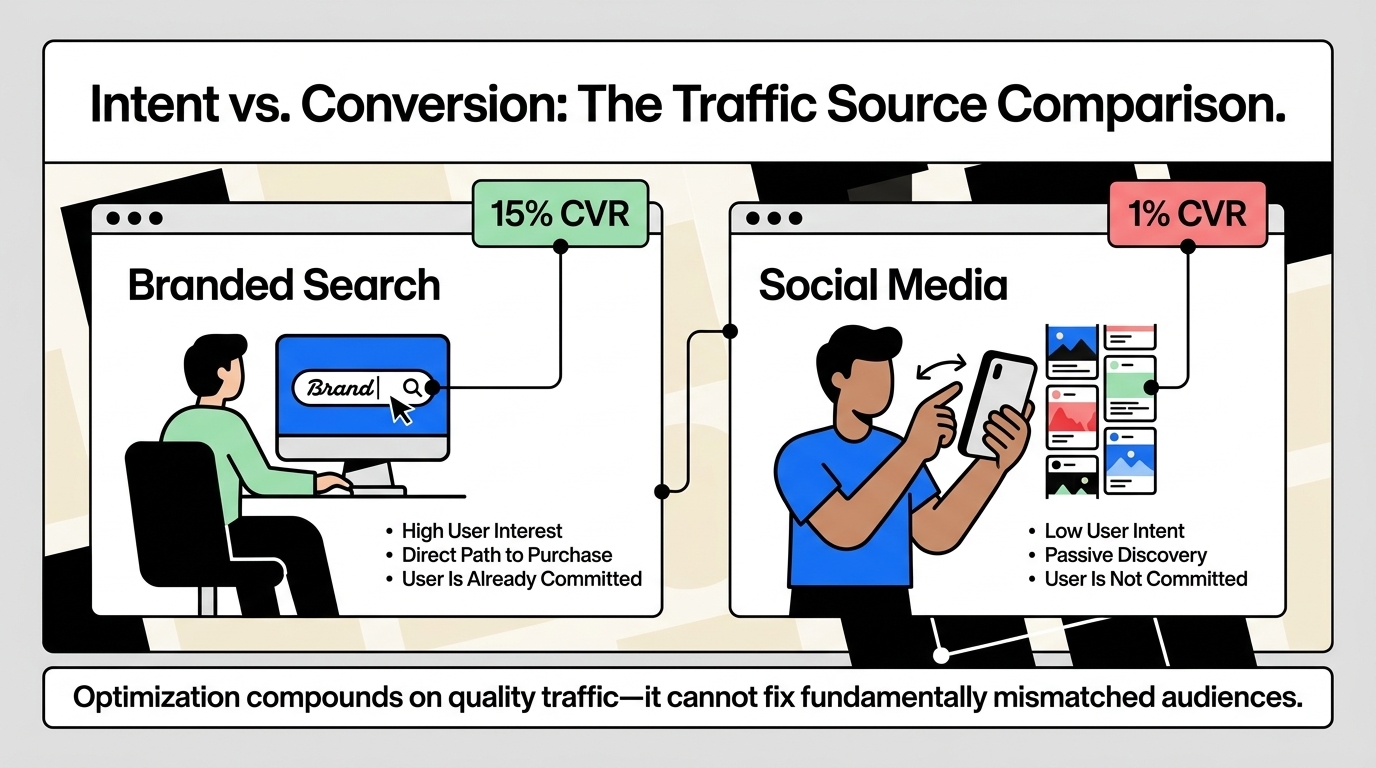
Why Traffic Quality Matters More Than Optimization
The most common CRO mistake is optimizing a page's design and copy before addressing traffic quality. A landing page that converts 3% of organic search visitors from high-intent keyword queries is performing well. The same page converting 0.4% of display ad traffic from broad audience targeting is also performing appropriately — because those visitors have much lower purchase intent, not because the page is poorly optimized. Before running A/B tests on button colors and headline variations, verify that traffic is coming from sources that match what you're offering, at a moment in the buyer's journey where your conversion ask is appropriate. Optimization compounds on quality traffic — it does very little to improve conversion from fundamentally mismatched audiences.
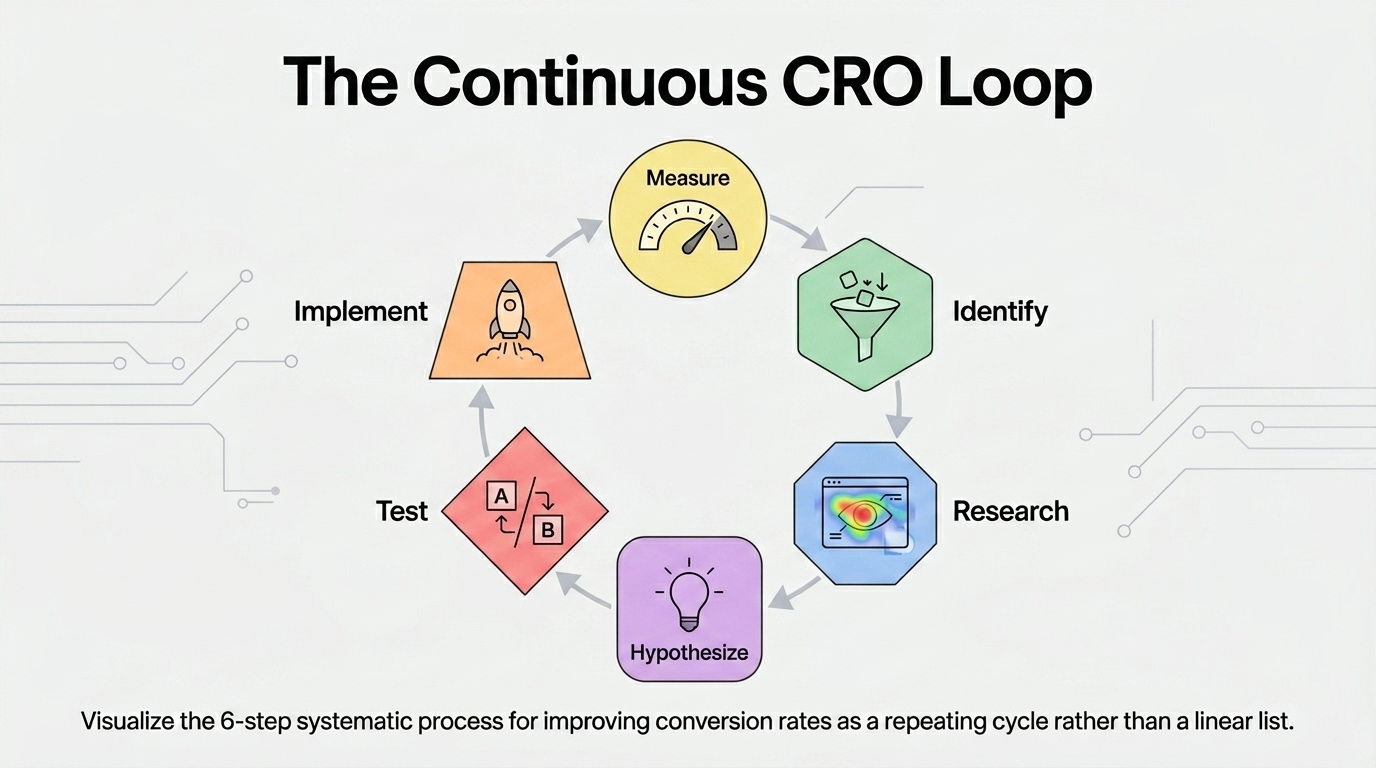
The CRO Process: How to Systematically Improve Conversion
StepActionToolsWhat to Learn1. Measure current baselineSet up conversion trackingGA4, Clarity, HotjarCurrent CVR by page, traffic source, device2. Identify highest-impact pagesFind pages with high traffic + low CVRGA4 Funnel reportsWhere are the biggest drop-off points?3. Qualitative researchSession recordings, heatmaps, user surveysHotjar, Microsoft ClarityWhy are users not converting? What are they doing?4. Form hypothesesIdentify specific elements to test—What change predicts improved CVR?5. Run A/B testsTest one change at a time with statistical significanceVWO, Optimizely, Google OptimizeDoes the change improve CVR?6. Implement winnersDeploy winning variants permanentlyCMS or developerLock in improvement, start next test
Quick Conversion Rate Wins (Under 1 Week Each)
Add social proof above the fold. Customer review counts, star ratings, logos of recognizable clients, or testimonial quotes placed in the first screen of your homepage or landing page address the primary uncertainty most visitors have — "can I trust this?" — without requiring any scroll. Moving social proof from a buried testimonials section to above-the-fold placement typically produces 15–25% conversion rate improvements immediately.
Simplify your primary CTA. "Get Started," "Start Free Trial," and "Book a Call" consistently outperform generic "Learn More" or "Click Here" CTAs. The CTA copy should describe the specific action and the immediate benefit: "Start Your Free 14-Day Trial" is more effective than "Get Started" because it specifies what starting looks like and what the benefit is. One prominent, specific CTA outperforms multiple competing CTAs on almost every page type.
Reduce form fields to the minimum. Every field on a form is a question the user must decide to answer. Removing fields that aren't essential for the immediate conversion — asking for company size and industry on an initial contact form, for example — consistently improves form completion rates by 15–35%. Collect additional information in the follow-up process rather than at the initial conversion barrier.
Fix mobile experience. The 64% mobile conversion rate gap relative to desktop on average websites represents an enormous opportunity. Audit your site on a real phone — not just in browser device simulation — and fix anything that requires pinching to tap, causes horizontal scrolling, makes forms painful to complete, or loads slowly on cellular. Mobile conversion is primarily a friction-removal problem, not a design problem.
The Bottom Line
A "good" website conversion rate is contextual — 2% is average for most businesses, 5%+ puts you in the top quartile, and 10%+ is exceptional. The most impactful conversion improvements come from ensuring traffic quality matches your offer, improving page load speed, clarifying your value proposition and CTA, adding credible social proof, and reducing mobile friction. Color optimization and button testing produce marginal improvements by comparison. Focus CRO investment on the high-impact structural factors first — the difference between bottom quartile and top quartile conversion rates is rarely about design choices and almost always about fundamentals.
At Scalify, every website we build is conversion-architected from the start — clear CTAs, prominent social proof, fast mobile experience, and the structural elements that produce above-average conversion rates rather than beautiful but non-converting pages.
Top 5 Sources
Conversion Rate by Traffic Source
Conversion rates vary dramatically by traffic source — and understanding this prevents the common mistake of evaluating overall website CVR without source context. High-intent traffic converts at much higher rates than cold traffic regardless of how optimized the landing page is:
Traffic SourceTypical CVR RangeWhy It's High or LowBranded organic search (your company name)8–25%User already knows and intends to find youNon-branded organic (informational queries)1–4%User is researching, not necessarily buyingNon-branded organic (commercial intent)3–8%User is evaluating options for a purchaseGoogle Ads (search, branded)10–20%High intent + ad already qualifies the clickGoogle Ads (search, non-branded)2–6%Good intent but competitive — users clicking multiple adsSocial media organic0.5–2%Low purchase intent — users are browsing, not searchingEmail marketing (existing list)5–20%Pre-qualified, warm audience with existing trustReferral traffic (links from other sites)3–8%Varies widely by referring source relevanceDisplay advertising / retargeting0.5–2% (cold), 2–5% (retargeting)Low intent cold; higher for retargeted engaged visitorsDirect traffic5–15%Users who type URL directly have highest familiarity and intent
A/B Testing: When to Test and How to Do It Right
A/B testing is the gold standard for CRO — but it's only valuable when done correctly. The most common A/B testing mistakes that produce false conclusions:
Running tests without sufficient traffic. An A/B test needs enough conversions in both variants to reach statistical significance — typically 100+ conversions per variant minimum, and often 300–500 for reliable conclusions. Running a test on a page with 50 conversions per week and declaring a winner after 2 weeks is not statistically valid. Most A/B testing tools will show when significance is reached — don't interpret results before that threshold.
Testing too many things simultaneously. Running an A/B test that changes headline, image, CTA color, and social proof placement simultaneously tells you whether the combination of changes performs better but doesn't tell you which change drove the result. Single-variable tests are slower but produce actionable insights. Multi-variate testing (MVT) is appropriate for high-traffic pages where multiple simultaneous variable tests can reach significance quickly.
Stopping tests at the wrong time. Ending a test the moment it reaches statistical significance — called "peeking" — produces more false positives than proper tests. Tests should run for at least 2 full weeks to capture weekly traffic patterns (business sites convert differently on weekdays vs. weekends), and should reach the pre-specified sample size rather than stopping at the first significant result.
Conversion Rate Optimization for E-Commerce
E-commerce conversion optimization has a well-developed playbook because purchase intent and friction are both clearly measurable. The highest-impact e-commerce CRO interventions: free shipping thresholds prominently displayed (reduces the primary checkout abandonment reason), product page social proof (review count + star rating displayed prominently, especially user photos), trust signals at checkout (secure payment badges, clear return policy), cart abandonment email sequences (recovering 5–15% of abandoned carts), and streamlined guest checkout (removing account creation as a required checkout step typically increases checkout completion by 25–35%). E-commerce checkout optimization produces some of the most reliable and consistent CRO results of any website category — because the friction points are well-understood and the interventions are well-tested across thousands of stores.
Conversion Rate in B2B vs. B2C
B2B conversion rates are structurally lower than B2C rates for reasons inherent to the buying process — not because B2B websites are worse. B2B purchases typically involve multiple stakeholders, longer evaluation cycles, higher price points, and more risk for the buyer. A B2B SaaS company with a 3% demo request rate is performing well; a consumer app with 3% signup conversion is mediocre. Understanding the B2B buying journey — awareness → consideration → evaluation → decision, with multiple touchpoints across weeks or months — changes what "conversion" even means. For B2B, the primary website conversion is often not the purchase but the first meaningful engagement: a demo request, a free trial, a consultation booking, or a content download that initiates a relationship the sales team then develops. Optimizing for these micro-conversions is more valuable than trying to force B2B purchasing decisions into single-visit conversion flows that don't match how enterprise buying actually works.


.jpeg)

.jpeg)


78 SW 7th St, Miami, FL 33130


