


Website Traffic Sources: Where Visitors Come From (2026 Data)
By Josh Ternyak

April 18, 2026
Organic search delivers 53% of website traffic and converts at 2.5-3.5%; email converts best at 3-6%. This comprehensive guide covers all 6 major traffic sources, the meaning of direct traffic, platform breakdown for social media, email's highest ROI of any channel, the multi-channel attribution problem, GA4 analysis framework, and the long-game case for organic search as a compounding business asset.
Website Traffic Sources: Where Visitors Come From (2026 Data)
Understanding where your website traffic comes from is the foundation of any intelligent digital marketing strategy. Traffic source data reveals which channels are actually driving visitors — and which visitors are most likely to convert — enabling smarter allocation of marketing budget and effort. Different traffic sources produce visitors with dramatically different intent levels, conversion rates, and acquisition costs. A visitor from a branded search query converts at 5–10x the rate of a visitor from a social media ad — and understanding why allows you to optimize both channels more effectively.
Key Website Traffic Statistics
The 6 Primary Website Traffic Sources
Traffic Source% of Total TrafficAvg. Conversion RateCost StructureSustainabilityOrganic Search (SEO)~53%2.5–3.5%Time investment upfront; low ongoing costVery High — compounds over timeDirect~22%4–6%Driven by brand awareness investmentHigh — reflects brand strengthPaid Search (Google/Bing Ads)~15%3–5%CPC — ongoing per clickLow — stops when budget stopsReferral~7%2–4%Link earning effort or PR investmentMedium-High — links persistSocial Media~5%0.5–1.5%Time + optional paid amplificationMedium — requires ongoing postingEmail~3%3–6%List building + platform costHigh — list asset grows over time
Organic Search Traffic: The Foundation
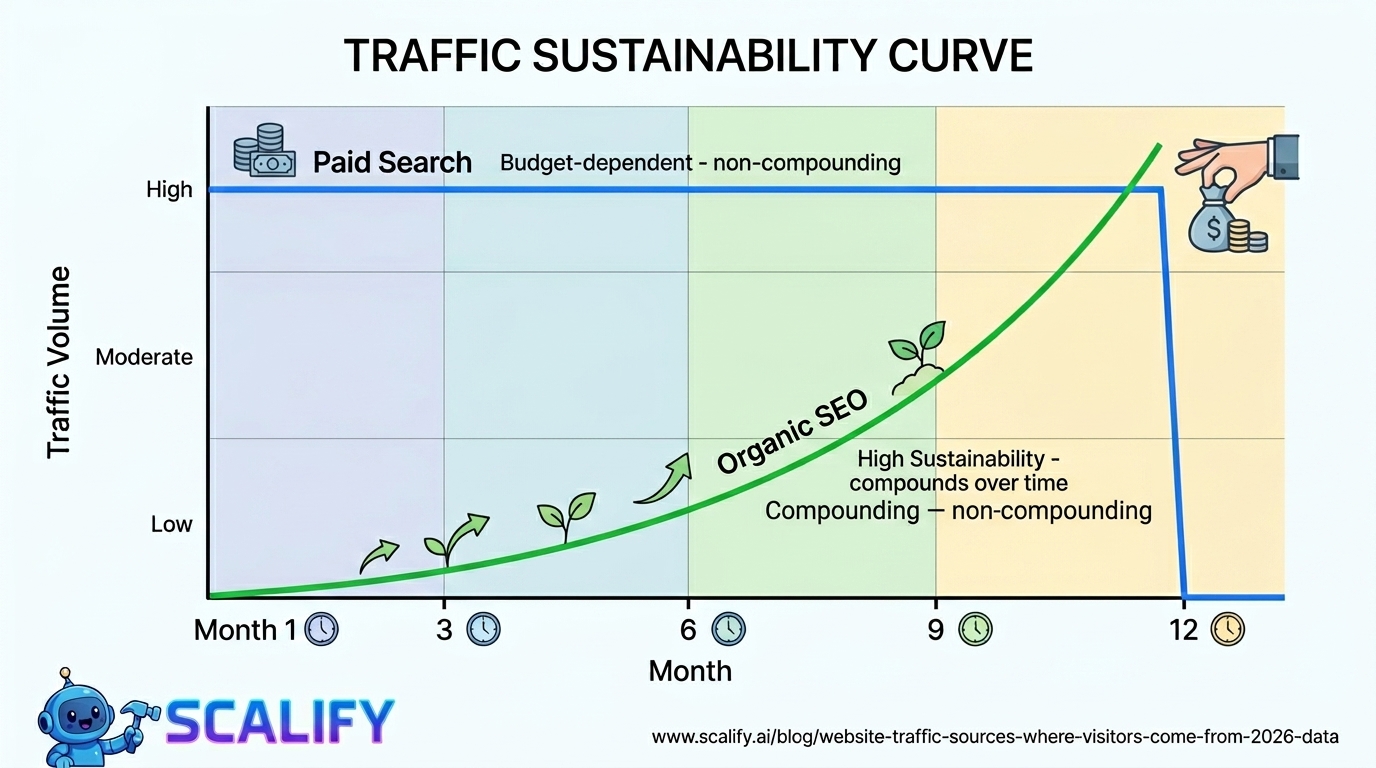
Organic search is the most valuable long-term traffic source for most websites because it compounds over time — each piece of content that ranks continues driving traffic without additional spending. The characteristics of organic search visitors: they arrive with specific intent aligned to the query they searched, they're self-qualified (they searched for something related to what you offer), and they convert at rates that reflect high initial relevance.
The distribution of organic traffic is extremely concentrated: the top-ranking result receives approximately 27.6% of clicks, the second result 15.8%, and the third 11%. Pages outside the top 3 receive progressively less traffic, and pages outside the top 10 receive virtually none. This means organic search traffic is fundamentally winner-take-most — the effort required to go from position 8 to position 1 is enormously worthwhile, while being satisfied with position 15 produces almost no traffic.
Building organic search as a primary traffic channel requires consistent investment over 12–24 months before it becomes a reliable, significant channel. The payoff: once established, organic traffic continues generating value for years with maintenance investment, unlike paid channels that require ongoing budget to generate any traffic.
Direct Traffic: What It Actually Means
Direct traffic in Google Analytics is often misunderstood. The technical definition is traffic that arrives without a referrer — meaning Google Analytics doesn't know where the visitor came from. Direct traffic includes: visitors who type your URL directly into their browser, visitors from bookmarks, visitors from mobile apps (where referrer data is often stripped), visitors from some email clients that don't pass referrer data, traffic from HTTPS pages to HTTP pages (where referrers are not passed), and incorrectly tagged or untagged campaigns. In practice, what appears as "direct" traffic is often a mix of genuine brand-navigational visitors and traffic from channels you're not tracking properly.
The high conversion rate of direct traffic (4–6%) reflects that most genuine direct visitors are already familiar with the brand — they've interacted before, bookmarked the site, or are returning to complete a transaction they started. This prior familiarity dramatically reduces the trust-building work that the website needs to do, resulting in higher conversion rates than cold traffic sources.
Paid Search: Immediate Traffic With Ongoing Cost
Paid search (Google Ads, Bing Ads) provides immediate traffic from highly specific commercial queries and is the most controllable of all traffic sources — budget, targeting, messaging, and landing page destination can all be adjusted in real-time. The trade-off is economic: paid search traffic has no residual value. Unlike organic content that continues ranking after being published, paid search ads generate traffic only while the budget is running. Stop spending and the traffic stops immediately.
Paid search is most compelling for: businesses with high customer lifetime value (where a $50 CPC producing a $2,000 customer is economically rational), businesses that need traffic immediately (before organic SEO has had time to build), specific commercial intent queries where ranking organically is difficult or slow, and remarketing to previous website visitors with targeted conversion messaging. The economics of paid search are simple: if cost per acquired customer is below customer lifetime value, it's worth scaling.
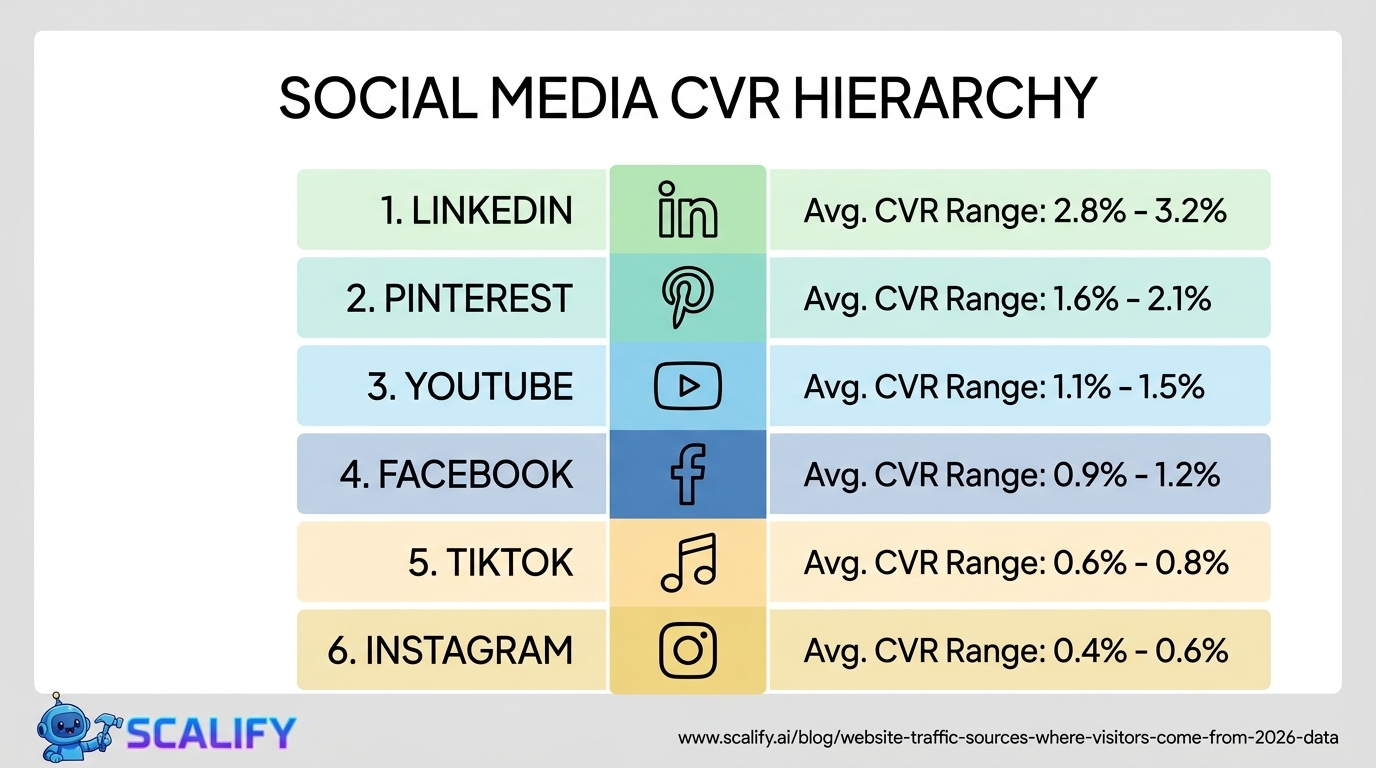
Social Media Traffic: Platform Breakdown
PlatformTraffic QualityContent TypeBest ForAvg. CVRLinkedInHigh — professional contextText posts, articles, videosB2B, professional services, recruiting1.5–3%FacebookMedium — mixed intentImages, videos, linksB2C, local business, community-building0.8–1.5%InstagramLow-Medium — discovery focusedImages, Reels, StoriesVisual products, lifestyle brands, brand awareness0.5–1%PinterestHigh for compatible nichesImages, infographicsHome décor, fashion, recipes, DIY1.5–2.5%YouTubeHigh — intent-basedVideos (informational, tutorial)Education, how-to, product demo, review1–2%TikTokLow — entertainment contextShort-form videoBrand awareness, reach, younger demographics0.3–0.8%X (Twitter)Low-MediumText, links, discussionNews, tech, finance, real-time commentary0.5–1%
Email Traffic: The Most Valuable Channel You Control
Email marketing consistently produces the highest return on investment of any digital marketing channel — estimated at $36–$42 for every $1 spent (Litmus, Campaign Monitor research). The primary reason: email is the only major digital marketing channel where you have direct ownership of the audience relationship. Social media algorithms can reduce your reach overnight; email lists remain yours. Organic rankings can fluctuate with algorithm updates; email deliverability is primarily within your control through list hygiene and sending practices.
Email traffic conversion rates (3–6%) exceed organic search (2.5–3.5%) because email subscribers are self-qualified — they opted in because they're interested in what you offer. Properly segmented email campaigns to the right subscriber segments can produce conversion rates of 8–15% for offers closely matched to the segment's demonstrated interests. The limitation of email as a traffic source is that list growth requires its own investment — content, lead magnets, and conversion-optimized signup mechanisms to continuously grow the list as subscribers churn or disengage.
Referral Traffic: Editorial Links and Partnerships
Referral traffic — visits originating from links on other websites — has two very different segments: editorial referral traffic (links from content other sites published about you or referencing you) and partnership referral traffic (links from business partners, directories, or formal link exchange arrangements). Editorial referral traffic from high-quality sites tends to convert well because visitors are pre-endorsed by the site that linked to you — they came because someone they trust recommended or mentioned your site. Partnership referral traffic quality varies widely based on the alignment between the referring site's audience and your offer.
How to Improve Each Traffic Source
Traffic SourcePrimary Growth LeverSecondary LeverTimelineOrganic SearchConsistent quality content targeting specific keywordsBacklink acquisition from relevant sites6–18 months for significant growthDirectBrand building through consistent presenceMemorable brand name and domainLong-term — reflects brand recognitionPaid SearchBetter quality scores + conversion rate optimizationNegative keyword management; bid optimizationImmediate; optimization ongoingReferralLink building outreach and PRPartnership development3–12 months per campaignSocial MediaConsistent posting + community engagementPaid promotion of top organic content3–6 months for meaningful trafficEmailList growth via lead magnets and signup optimizationSegmentation and personalizationList growth ongoing; results immediate per campaign
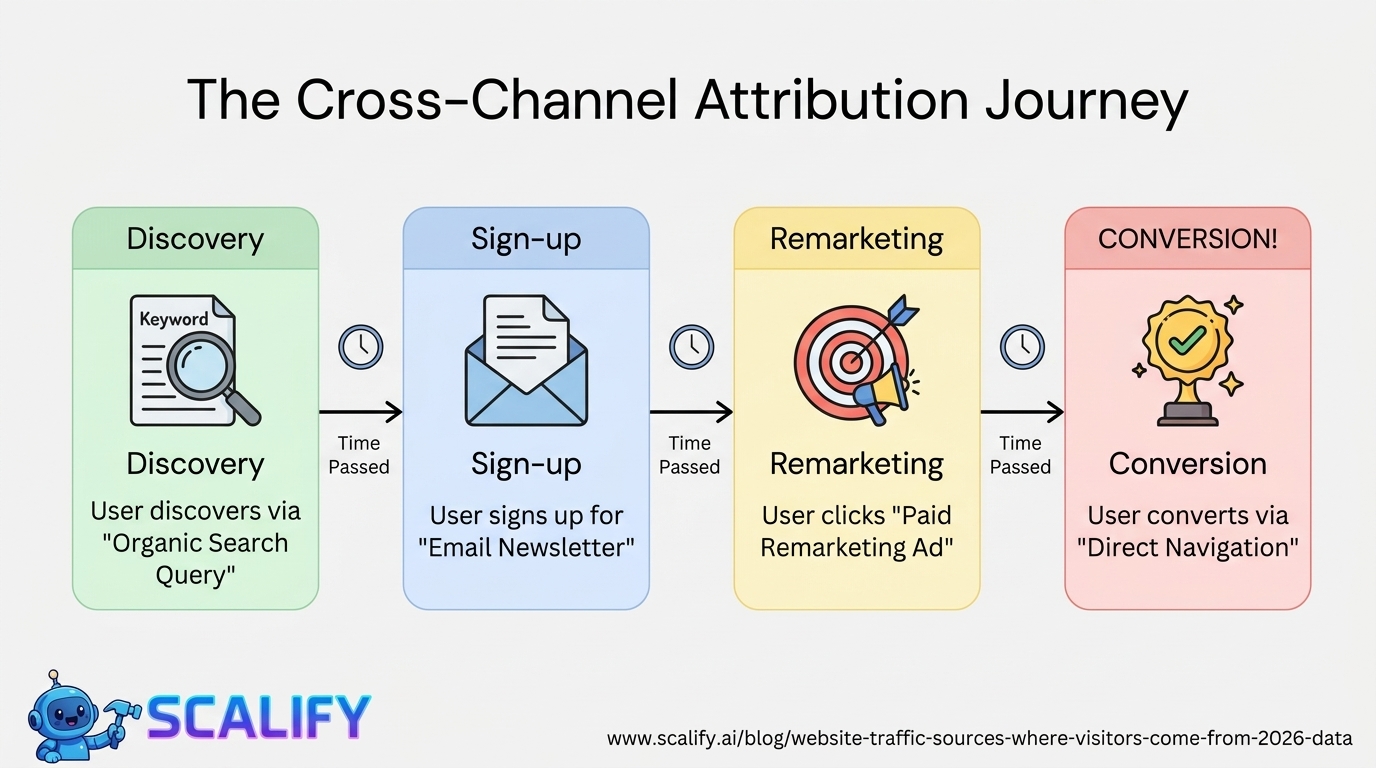
The Multi-Channel Attribution Problem
In reality, most conversions involve multiple touchpoints across multiple channels before the final conversion. A customer might discover the brand through organic search, subscribe to the email list, receive 3 email newsletters, click a retargeting ad, and then convert through what appears as "direct" traffic. Last-click attribution (the default in most analytics platforms) credits the last touchpoint (direct) and ignores the earlier touchpoints (organic search, email, paid) that were equally essential to the conversion journey.
Google Analytics 4 provides more sophisticated attribution models — first click, linear, position-based, data-driven — that distribute conversion credit more accurately across the full customer journey. For businesses making significant investment in multiple traffic channels, switching from last-click to data-driven attribution in GA4 produces a more accurate picture of which channels are actually contributing to conversions — and enables smarter budget allocation across the marketing mix.
The Bottom Line
Organic search delivers 53% of website traffic and compounds over time; email converts best (3–6%) and represents owned audience; paid search provides immediate, controllable traffic with ongoing cost; social media drives awareness but converts poorly; direct traffic reflects brand strength; and referral traffic from editorial links reflects reputation. The most resilient marketing strategies distribute investment across multiple traffic sources — building organic search as the long-term foundation while using paid search for immediate traffic, email for highest conversion, and social for brand awareness and community. Over-reliance on any single source creates vulnerability: algorithm changes can eliminate organic traffic, platform changes can reduce social reach, and budget cuts can eliminate paid traffic overnight.
At Scalify, we build professional websites designed to perform across all traffic sources — technically optimized for organic search, conversion-optimized for paid traffic, and structured to capture email subscribers that become a long-term business asset.
Top 5 Sources
Analyzing Your Traffic Mix in Google Analytics 4
Understanding your traffic source breakdown begins with GA4's Acquisition reports. Navigation: Reports → Acquisition → Traffic Acquisition. The default view shows sessions by Channel Group (Organic Search, Direct, Paid Search, Organic Social, Email, Referral, etc.). The most important comparison points:
Metric to CompareWhy It MattersWhat a Healthy Mix Looks LikeSessions by channelAbsolute traffic from each sourceOrganic 40%+; Direct 20%+; Email and Referral growingEngagement rate by channelAre visitors from this channel interested?Higher than 50% for organic, direct, email; lower for paid, socialConversion rate by channelWhich channels actually drive outcomes?Email and branded search highest; social lowestRevenue/leads by channelThe business case for each channelMay differ significantly from traffic share
The insight that surprises most businesses: the channels with the most traffic are rarely the channels with the best conversion rates. Social media might drive 15% of traffic and 3% of conversions; email might drive 3% of traffic and 15% of conversions. Understanding this ratio — conversion contribution divided by traffic contribution — reveals which channels are punching above their weight and deserve investment.
Growing Organic Traffic: The Long Game That Pays Off
For most businesses without massive paid advertising budgets, organic search is the most important traffic channel to invest in — because the returns compound over time in a way that paid channels don't. Every piece of quality content that ranks continues driving traffic for months or years after publication. Every backlink earned continues building authority. Every technical improvement made continues benefiting search visibility without ongoing expenditure. This compounding return structure is why businesses that invest consistently in organic search for 24+ months typically see their cost-per-acquisition through that channel decrease over time, while paid search CPA often increases as competition drives up CPCs.
The organic traffic growth formula is straightforward even if the execution requires sustained effort: identify specific keyword queries your target customers search for, publish comprehensive content that fully addresses those queries, earn backlinks from credible sources in your industry, and maintain technical SEO fundamentals that ensure your content is crawlable and indexable. Do these things consistently for 12–24 months and organic search becomes a reliable, growing, cost-efficient traffic channel — the infrastructure of a sustainable digital marketing program that doesn't disappear when budget gets cut.


.jpeg)

.jpeg)


78 SW 7th St, Miami, FL 33130


