


How to Speed Up Your Website (And Why It Matters for SEO)
By Josh Ternyak

April 18, 2026
10 highest-impact speed optimizations with ROI calculation framework.
How to Speed Up Your Website (And Why It Matters for SEO)
Website speed directly affects search rankings, conversion rates, and user experience — making it one of the highest-ROI technical improvements available to any website owner. Google uses Core Web Vitals as ranking signals, and slow websites see measurably lower organic rankings than faster equivalents. On the conversion side, every additional second of load time reduces conversions by 7% on average. A website that loads in 1 second converts 3x better than one that loads in 5 seconds, from identical traffic. Speed is not a nice-to-have — it's a revenue lever with quantifiable impact.
Key Website Speed Statistics
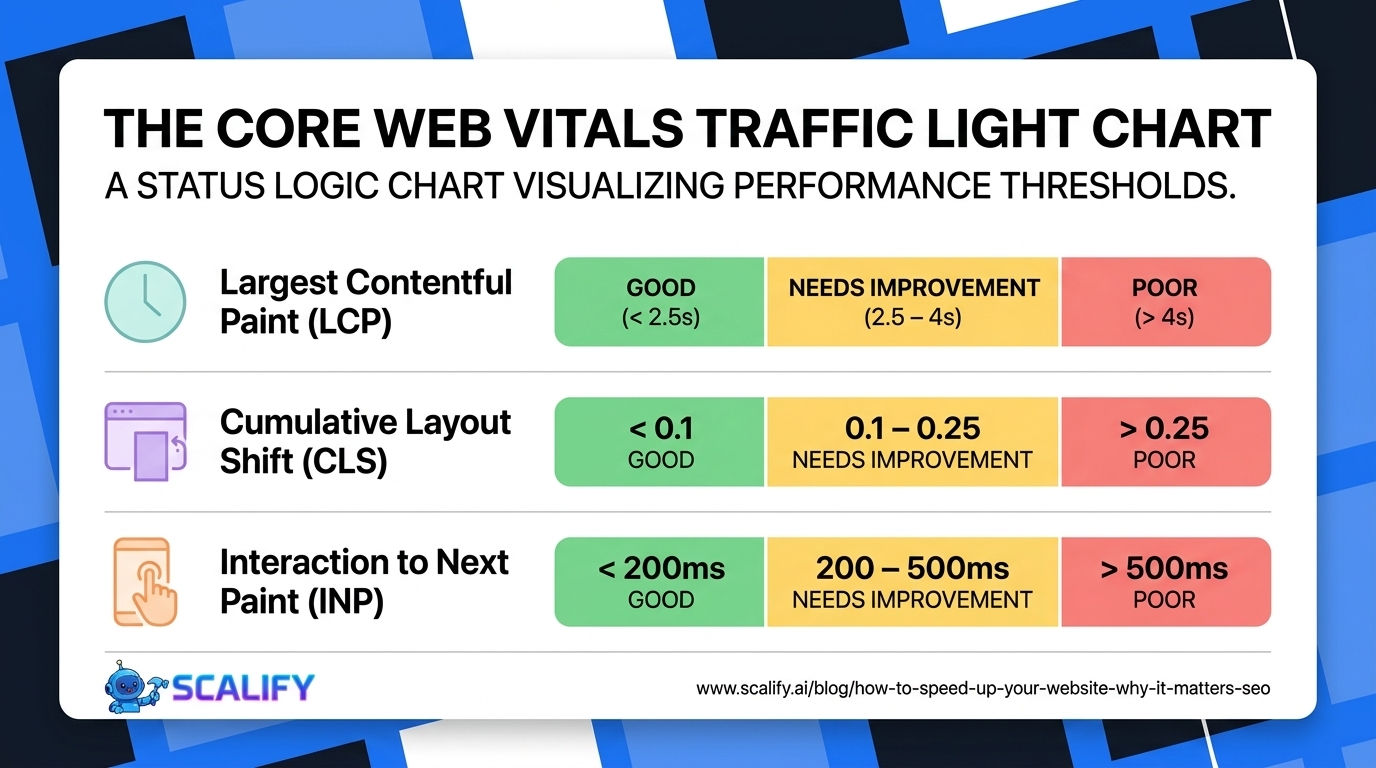
The 3 Core Web Vitals: What Google Measures
MetricWhat It MeasuresGoodNeeds WorkPoorLCP (Largest Contentful Paint)Loading speed of the main page elementUnder 2.5s2.5–4sOver 4sCLS (Cumulative Layout Shift)Visual stability — elements moving after loadUnder 0.10.1–0.25Over 0.25INP (Interaction to Next Paint)Responsiveness to user interactionsUnder 200ms200–500msOver 500ms
The 10 Highest-Impact Speed Optimizations
1. Optimize Images (Biggest Impact)
Images cause the majority of speed problems on most websites. The fixes: convert to WebP format (25–34% smaller), compress to under 200KB for large images, set explicit width and height attributes (prevents CLS), use loading="lazy" on below-fold images, and preload the hero/LCP image with <link rel="preload" fetchpriority="high">. Image optimization alone can improve LCP by 1–2 seconds on image-heavy pages.
2. Eliminate Render-Blocking Resources
JavaScript and CSS files that load in the <head> block the browser from rendering the page until they finish downloading. Solutions: add defer or async to non-critical scripts, move non-critical CSS to load after the initial render with media queries, and inline critical CSS (the styles needed for above-fold content) directly in the HTML <head>. This is the #1 fixable cause of poor LCP on JavaScript-heavy pages.
3. Enable Caching
Browser caching stores static resources (CSS, JS, images) in the visitor's browser so repeat visits don't re-download them. Server-side caching stores rendered page HTML so the server doesn't reprocess every request. Set cache-control headers with long expiry for static assets: Cache-Control: max-age=31536000, immutable for versioned assets. For WordPress, WP Rocket or W3 Total Cache handles both browser and server caching configuration. For Next.js on Vercel, caching is automatic.
4. Use a CDN
A Content Delivery Network serves your website from servers closest to each visitor globally. A visitor in Tokyo accessing a website hosted in Virginia has to wait for data to travel across the Pacific — adding 150–300ms of latency that a CDN eliminates by serving from a Tokyo edge node instead. Cloudflare's free tier provides a basic CDN for any website with minimal configuration. Vercel, Netlify, and most modern hosting platforms include edge CDNs automatically.
5. Minimize JavaScript Bundle Size
Modern JavaScript frameworks (React, Vue) can produce large bundles that take significant time to download and execute, delaying interactivity. Optimizations: code splitting (loading only the JavaScript needed for the current page), tree shaking (removing unused code from bundles), and replacing heavy libraries with lighter alternatives (e.g., date-fns instead of moment.js, native fetch instead of axios). Webpack Bundle Analyzer and Next.js's built-in bundle analysis identify the largest contributors to bundle size.
6. Improve Server Response Time (TTFB)
Time to First Byte (TTFB) measures how long the server takes to start responding. Poor TTFB (over 200ms) delays everything else. Improvements: upgrade hosting to a faster plan or provider, implement server-side caching, optimize database queries that run on page load, and use a CDN for edge-rendered responses. For WordPress sites, a quality managed hosting plan (Kinsta, WP Engine, Rocket) dramatically improves TTFB over shared hosting.
7. Fix Layout Shift (CLS)
Cumulative Layout Shift happens when elements move after the initial render — often causing users to click the wrong element as a button shifts just as they tap. Common causes and fixes: images without width/height attributes (add them), ads or embeds that load asynchronously and push content (reserve space with min-height CSS), custom fonts that cause text reflow (use font-display: optional or preload fonts), and dynamically injected banners or cookie notices that push content down (anchor to bottom instead of top).
8. Preload Critical Resources
Resource hints tell the browser to start fetching important resources earlier. Key preloads that produce measurable speed improvements: the LCP hero image (<link rel="preload" as="image">), the main font file (<link rel="preload" as="font" crossorigin>), and critical above-fold CSS. Don't over-preload — preloading everything defeats the purpose by competing for bandwidth. Focus preloads on the 2–3 resources that directly affect LCP or visual completeness.
9. Minimize Third-Party Scripts
Every third-party script (analytics, chat widgets, advertising, social embeds, tag managers) adds load time — sometimes 200–500ms per script. Audit all active third-party scripts, remove any that aren't actively used, lazy-load non-critical ones (chat widget doesn't need to load until user scrolls or interacts), and load analytics scripts with defer. Google Tag Manager is particularly prone to script bloat — audit your GTM container regularly and remove outdated tags.
10. Enable HTTP/2 or HTTP/3
HTTP/2 allows multiple resources to load simultaneously over a single connection, dramatically improving load time for pages with many resource requests. HTTP/3 (QUIC protocol) adds additional improvements for mobile and high-latency connections. Most modern hosting platforms enable HTTP/2 by default. Check your site's protocol at httpstatus.io — if it's still HTTP/1.1, contact your hosting provider or CDN to enable HTTP/2.
Tools for Measuring and Diagnosing Speed Problems
ToolWhat It MeasuresBest ForCostGoogle PageSpeed InsightsCore Web Vitals + actionable recommendationsDiagnosing specific issues on any pageFreeGoogle Search Console (CWV)Real user Core Web Vitals data for your siteUnderstanding actual user experience at scaleFreeGTmetrixWaterfall loading chart, performance gradesUnderstanding load sequence and resource sizesFree tier availableWebPageTestAdvanced technical diagnostics, multiple locationsDeep technical analysis for specific issuesFreeLighthouse (Chrome DevTools)Performance, accessibility, SEO in one reportLocal testing before deploymentFree (built into Chrome)
Platform-Specific Speed Optimization
WordPress: Install WP Rocket (best-in-class caching plugin), EWWW Image Optimizer (WebP conversion + compression), and host on managed WordPress hosting (Kinsta, WP Engine, Cloudways). These three changes alone typically bring a WordPress site from 60s to 85+ on PageSpeed Insights without any code changes.
Shopify: Compress all product images before upload using Squoosh, remove unused apps (each adds script overhead), use a lightweight theme (Dawn by Shopify is the fastest), and enable Shopify's built-in lazy loading. Shopify's infrastructure is already highly optimized — most performance issues on Shopify come from image size and excess app scripts.
Webflow: Webflow handles hosting, CDN, and minification automatically. Focus on: compressing images before uploading to the Webflow editor (Webflow doesn't auto-compress), minimizing custom code embeds, and using Webflow's built-in lazy loading (checkbox on each image element).
Next.js: Use next/image for automatic WebP conversion, lazy loading, and blur placeholder. Enable static site generation (SSG) or Incremental Static Regeneration (ISR) for content-heavy pages. Deploy on Vercel for automatic edge CDN and HTTP/3 support.
The Bottom Line
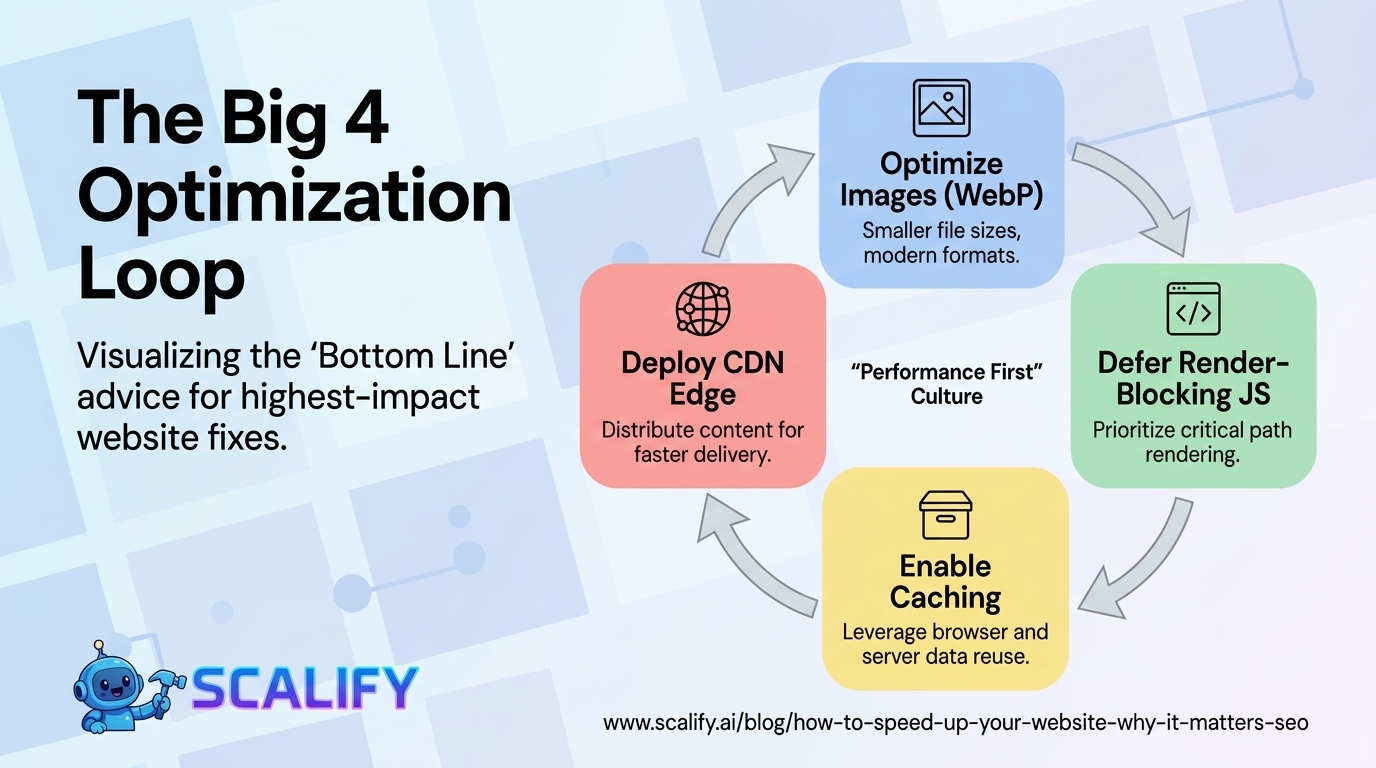
Website speed improvements produce measurable returns in both rankings and conversions — making them among the highest-ROI investments in digital marketing. Start with image optimization (largest individual impact), then eliminate render-blocking resources, enable caching, and add a CDN. These four improvements typically produce 20–40 point PageSpeed Insights improvements and pass Core Web Vitals on most sites without architectural changes. Use Google Search Console's Core Web Vitals report and PageSpeed Insights to identify specific issues on your specific pages rather than optimizing generically.
At Scalify, every website we build passes Core Web Vitals from day one — optimized images, deferred scripts, edge CDN, and clean architecture that produces fast load times without post-launch remediation.
Top 5 Sources
Speed Optimization for Mobile: The Priority Platform
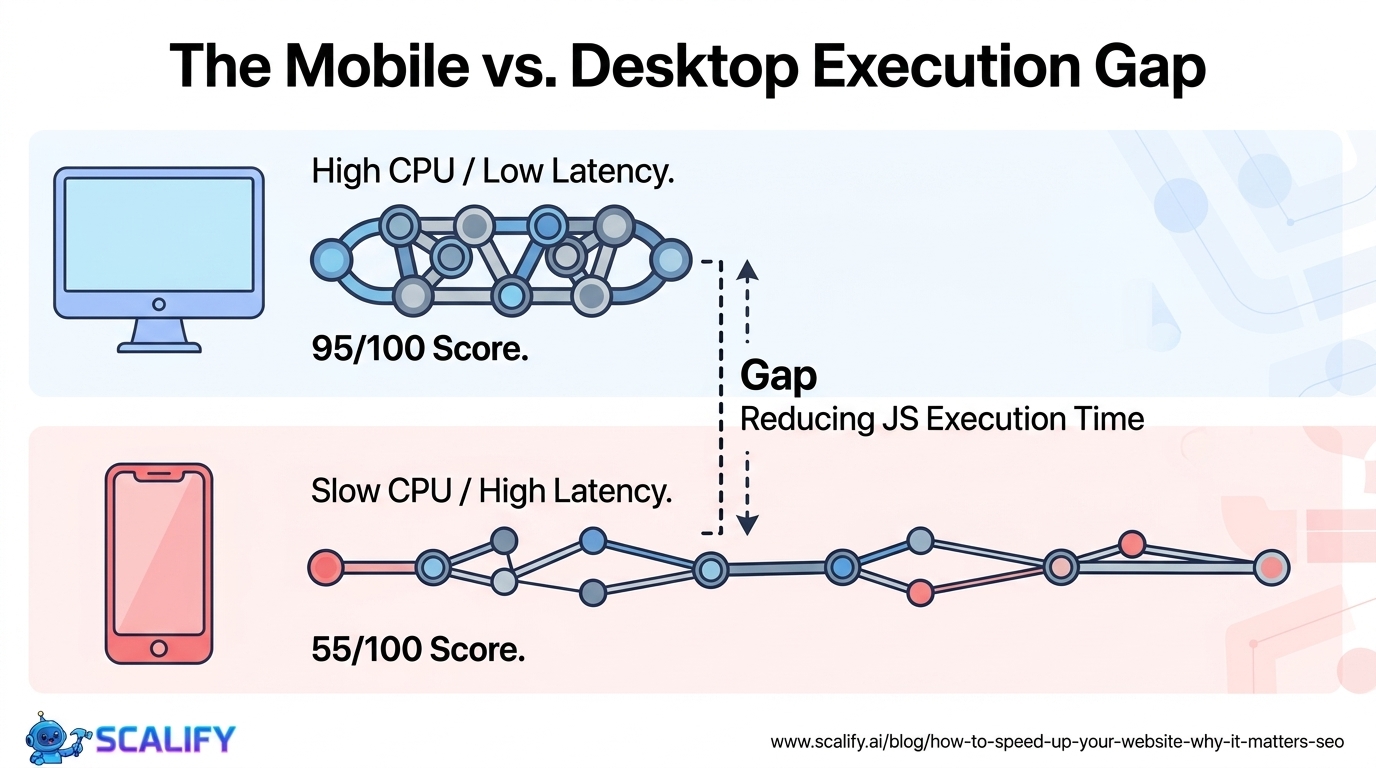
Over 60% of web traffic is mobile, and mobile networks have higher latency and lower bandwidth than typical desktop connections — making mobile speed optimization the highest-priority performance context for most websites. Mobile-specific performance improvements beyond what applies to desktop: reducing JavaScript execution time (mobile CPUs are 3–5x slower than desktop CPUs for JS execution), using service workers to cache resources for offline/low-connectivity scenarios, and eliminating scroll-jacking or animation-heavy experiences that degrade on mid-range mobile hardware.
The gap between desktop and mobile PageSpeed Insights scores is typically 20–40 points — a site scoring 95 on desktop may score 55 on mobile. This gap primarily reflects JavaScript execution time (desktop handles it much faster), image serving (desktop bandwidth is faster), and render-blocking resources (affects mobile more due to slower initial connection). Closing this gap by targeting mobile-specific optimizations — particularly reducing JavaScript parse/execute time and optimizing the critical rendering path — produces the largest real-world performance improvements for actual visitors.
Speed Optimization ROI: Calculating the Business Case
Making the case for speed optimization investment requires translating technical improvements into business outcomes. The calculation framework: current conversion rate × current monthly traffic × average conversion value = current monthly revenue. Apply the documented 7% improvement per second saved: if a 2-second load time improvement is achievable (common on unoptimized sites), that's approximately 14% more conversions from the same traffic. For a site with 10,000 monthly visitors, 2% conversion rate, and $500 average order value: ($10,000 × 0.02 × $500) × 0.14 = $14,000 in additional monthly revenue — from a technical optimization that typically costs $2,000–$5,000 in developer time. The first-month ROI is 280–700%, and the improvement compounds indefinitely because the same traffic continues converting at the higher rate.
What Good Performance Looks Like in 2026
The performance bar has risen significantly as modern hosting, frameworks, and tooling have made excellent performance more accessible. In 2026, "good" performance for a content or marketing website means: Lighthouse score 90+ on mobile (not just desktop), Core Web Vitals all passing (green) in Google Search Console's field data, TTFB under 200ms measured from the primary target market's location, and LCP under 2 seconds for the most important landing pages. These are achievable targets for any website built on modern platforms with proper optimization — not aspirational benchmarks that require extraordinary engineering effort. If your website falls significantly short of these targets, the performance issues are most likely image-related or JavaScript-related and addressable through the optimizations covered in this guide without major architectural changes.
How to Prioritize Speed Work: The Quick-Win Framework
Speed optimization has a prioritization problem: there are many possible improvements, and not all are equally impactful for a given site. The approach that produces the fastest results: run PageSpeed Insights on your 3 most important pages (homepage, primary landing page, top product/service page), identify the specific issues flagged under "Opportunities" and "Diagnostics," and fix the highest estimated impact items first. Google's PageSpeed Insights shows estimated time savings for each recommendation — prioritize the items showing 0.5+ second estimated improvements over those showing 0.1 second improvements. This focused approach produces the maximum Core Web Vitals improvement per hour of developer time invested, and typically produces enough improvement to pass Core Web Vitals on most sites within 2–4 weeks of focused effort.
The issues that appear most frequently in PageSpeed Insights audits and produce the most dramatic improvements when fixed: properly sizing images (too-large images served to mobile), eliminating unused JavaScript (dead code from removed features or plugins that still loads), reducing unused CSS (stylesheets that are loaded but apply to no elements on the page), and improving server response time (hosting upgrade or caching implementation). These four categories cover the majority of performance problems on typical content and marketing websites, and addressing them sequentially in order of estimated impact is the most efficient path to a dramatically faster site.


.jpeg)

.jpeg)


78 SW 7th St, Miami, FL 33130


