


How to Run A/B Tests on Your Website (Complete 2026 Guide)
By Josh Ternyak

April 17, 2026
A/B testing produces 20-30% annual conversion improvement when done with statistical rigor. This comprehensive guide covers the complete 8-step testing process, statistical significance explained, what to test (prioritized by impact and win rate), tool comparison, step-by-step first test walkthrough, result analysis, advanced techniques (MVT, bandit testing, personalization), building a testing culture, and when not to A/B test.
How to Run A/B Tests on Your Website
A/B testing — also called split testing — is the practice of showing two different versions of a page, element, or experience to different segments of your audience simultaneously and measuring which version produces better results. Done correctly, A/B testing is the most reliable way to make conversion optimization decisions because it produces causal evidence (this specific change caused this specific improvement) rather than correlation or intuition. Done incorrectly, it produces false confidence in bad decisions — which is why understanding the methodology is as important as having access to the tools.
Key A/B Testing Statistics
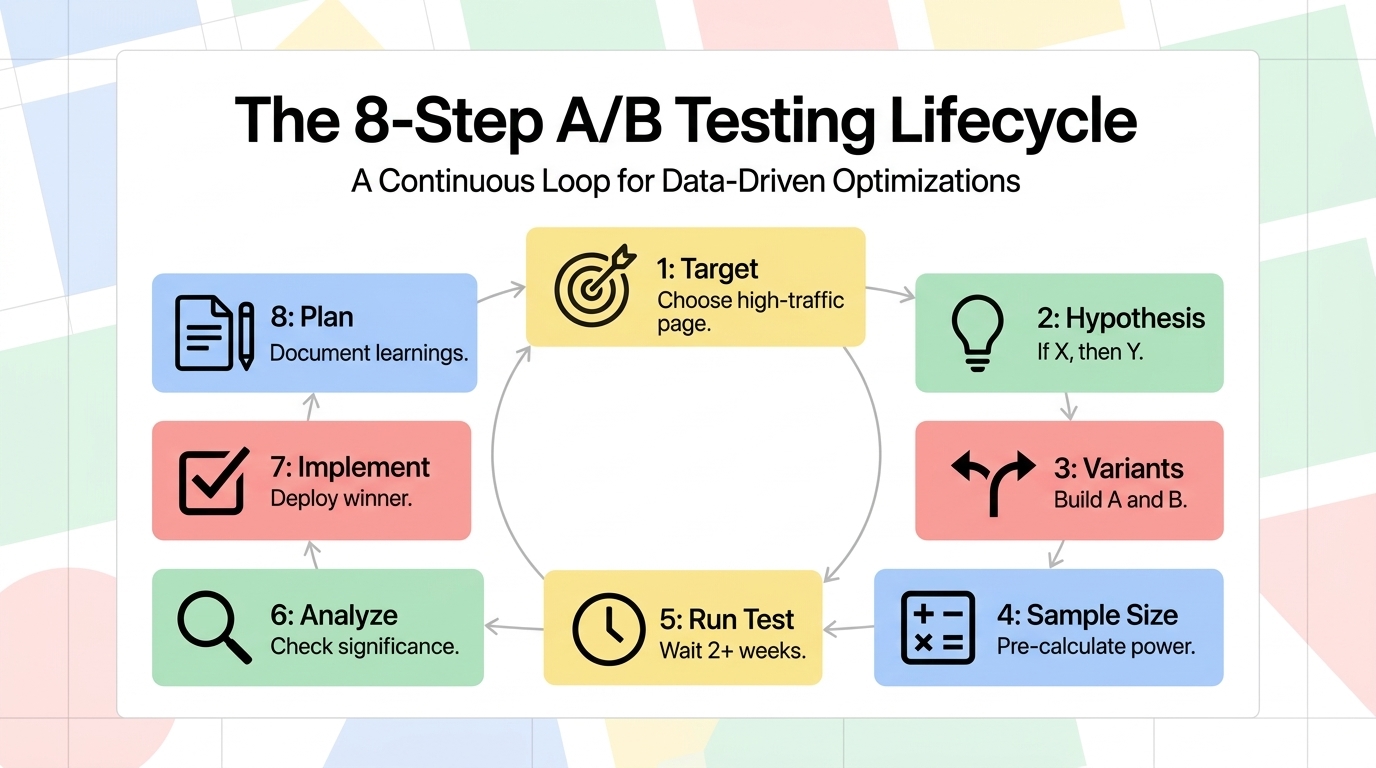
The A/B Testing Process
StepActionToolsCommon Mistakes1. Choose what to testSelect a high-traffic page with a clear conversion goalGoogle Analytics 4, heatmapsTesting low-traffic pages where significance takes months2. Form a hypothesis"Changing X to Y will improve Z because of reason Q"Research + customer dataTesting without a clear hypothesis — not learning from results3. Create variantsBuild version B that differs in ONE specific element from version AA/B testing tool, developerChanging multiple elements at once — can't attribute results4. Set sample size before testingCalculate required sample size for statistical powerSample size calculatorsDeciding sample size after seeing early results (peeking)5. Run the testSplit traffic 50/50; run for the pre-specified durationVWO, Optimizely, AB TastyStopping early when results look good or bad6. Analyze resultsCheck significance at 95%+ confidence; measure primary and secondary metricsTesting tool analyticsDeclaring winner at first significant result (multiple testing problem)7. Implement winnerDeploy winning variant; document learningsDeveloper, CMSImplementing but not documenting what was learned and why8. Plan next testUse learnings to inform the next hypothesisTest logRunning tests in isolation without building compounding knowledge
Statistical Significance: The Most Misunderstood Concept
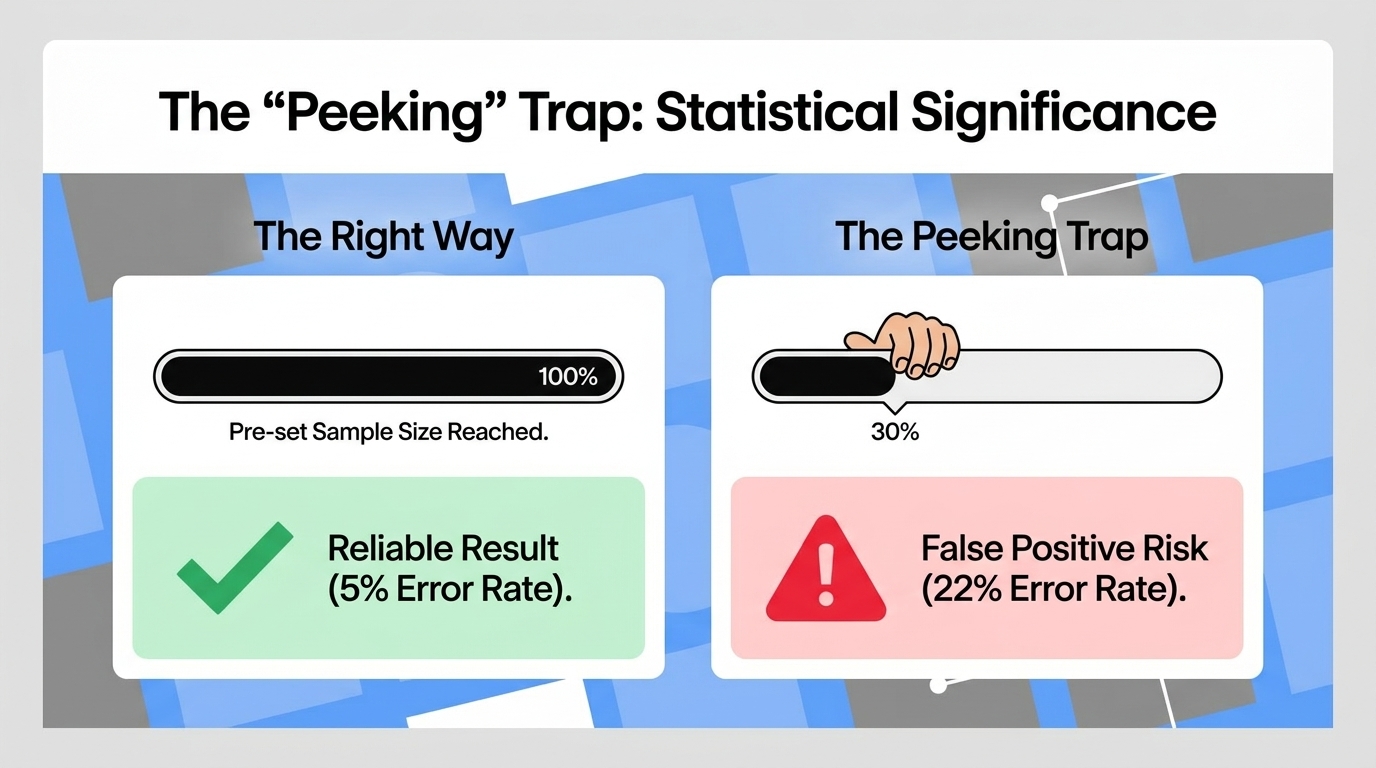
Statistical significance is the threshold at which you can be confident that observed test results reflect a real difference between variants rather than random chance. The standard in A/B testing is 95% confidence — meaning you'd expect to see this result by chance only 5% of the time if there were no true difference between variants. Below this threshold, you cannot reliably conclude that one variant is better than the other.
The most common A/B testing mistake is stopping a test as soon as it reaches 95% significance — which it will do repeatedly by chance if you check frequently enough. This "peeking" problem inflates false positive rates dramatically: a test checked daily and stopped at first significance produces false positives at a rate of 22% rather than 5%. The correct approach: determine required sample size before starting (using a calculator like Evan Miller's sample size calculator), commit to running until that sample size is reached regardless of interim results, and analyze only at the predetermined endpoint.
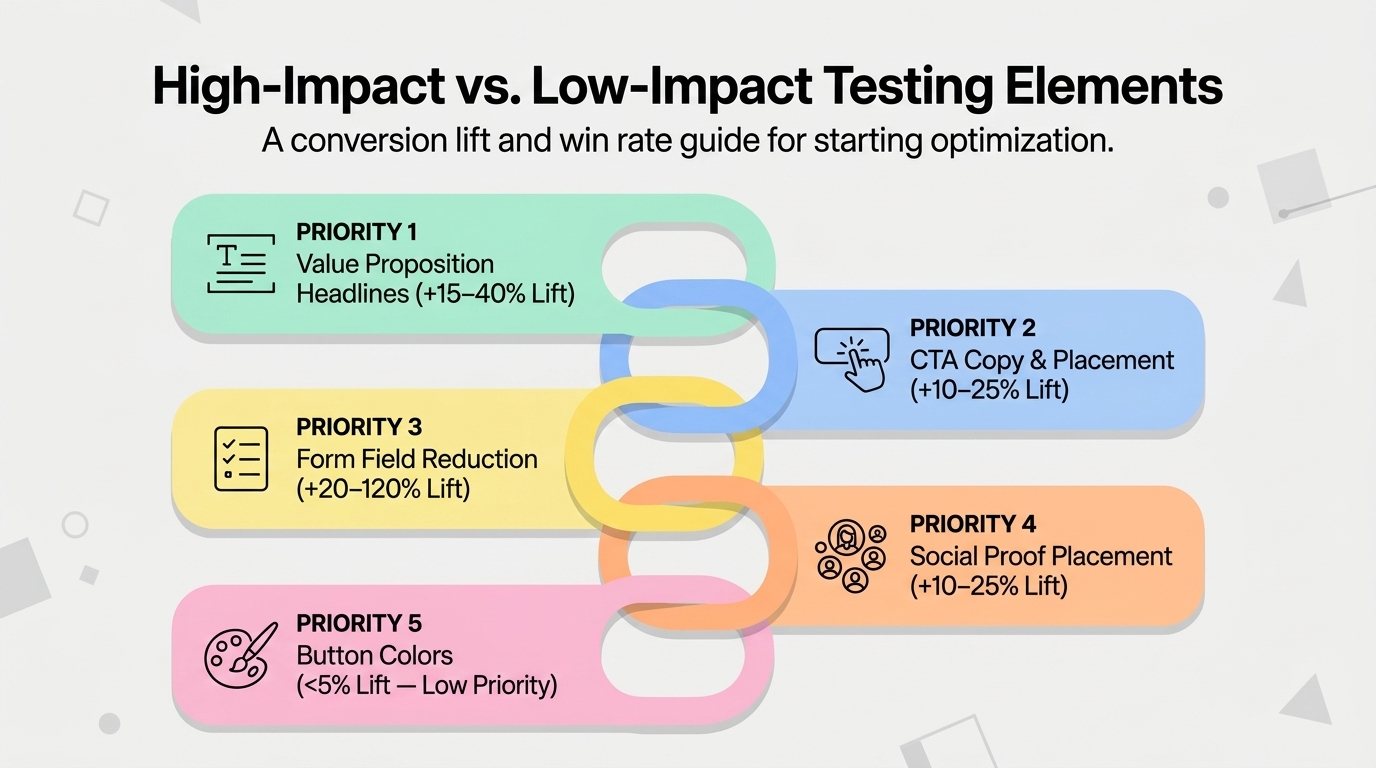
What to Test: Prioritized by Impact
ElementAverage Win RateAverage ImprovementTest EffortPriorityHeadline / value proposition copyMedium — 35% of tests winHigh — often 15–40% when it winsLow1 — Start hereCTA copyHigh — 70% of tests winMedium — 10–25% typicalVery Low2 — Easy winsCTA placement / prominenceMedium-High — 50%Medium — 10–20%Low-Medium3Form length reductionHigh — 65%High — removing fields often 20–120% liftLow4 — Low effort, high potentialSocial proof addition/repositioningMedium — 40%Medium — 10–25%Low5Page layout / content orderMedium — 35%Medium-High — 15–35%Medium6Pricing presentationVariableHigh when pricing is a barrierLow7 — For price-sensitive productsButton color / designLow — 20%Low — usually under 5%LowLast — common to test, rarely meaningful
A/B Testing Tools Compared
ToolBest ForSetup ComplexityPriceVWO (Visual Website Optimizer)Most businesses — best UI, strong statisticsLow — visual editor$199–$999+/moOptimizelyEnterprise, complex experimentsMedium-HighCustom — enterprise pricingAB TastyMid-market, marketing teamsLow — visual editorCustom — mid-rangeGoogle Optimize (sunset)Replaced by GA4 Experiments — limited functionalityLowFree (very limited)Unbounce Smart TrafficLanding pages specificallyVery Low — built-in$99–$200+/moFeature flags (LaunchDarkly, Split)Technical teams — full-stack experimentsHigh — requires dev$50–$300+/mo
Running Your First A/B Test: Step by Step
Choose the right page. Your first A/B test should be on the page with the most traffic AND a clear, measurable conversion goal. This is usually your homepage (if you have a clear primary CTA), a product/service page with a high visit-to-conversion funnel, or a landing page from paid advertising where improving conversion directly reduces cost-per-acquisition. Avoid testing low-traffic pages that will take months to reach statistical significance.
Develop a specific hypothesis. "Changing the CTA from 'Contact Us' to 'Get a Free Consultation' will increase CTA clicks because it specifies the immediate benefit rather than the generic action." This hypothesis format — "changing X to Y will improve Z because of reason Q" — ensures you're testing a specific idea with an expected mechanism, not just randomly trying things. Hypotheses grounded in specific reasoning produce more consistent learning even when the test doesn't win.
Calculate sample size first. Use Evans Miller's sample size calculator (evansmmiller.com) or Optimizely's calculator: enter your current conversion rate, the minimum detectable effect you care about (how small an improvement is worth deploying), and desired statistical power (80% is standard). The calculator tells you how many visitors you need in each variant before you can draw valid conclusions. Commit to running until you reach this number.
Run for complete business cycles. At minimum, run tests for 2 full calendar weeks — this captures weekday/weekend variation that can cause misleading results if a test runs only Tuesday through Friday. For B2B sites with strong weekday/weekend behavioral differences, 4 weeks is the minimum. Seasonal peaks and promotional periods should be avoided for baseline conversion tests.
Analyzing Test Results: What to Actually Look At
When a test completes, the analysis goes beyond the simple question of whether variant B outperformed variant A:
Primary metric: The conversion goal you specified before the test — the "win/loss" determination.
Secondary metrics: Did the winning variant harm any other important metrics? A variant that increases lead form completions but decreases lead quality (measuring downstream conversion to customers) may not be a real improvement. Always check secondary metrics before declaring a winner.
Segment analysis: Does the variant perform differently for different visitor segments? A CTA change might produce a 20% improvement for mobile visitors and a -5% change for desktop visitors — the correct decision (implement for mobile only, not desktop) requires this analysis.
Statistical significance AND sample size: Both must be met. A test can reach 95% statistical significance with only 30 conversions per variant — but that's not enough data to trust the result for anything other than massive effect sizes. Both significance AND sample size requirements must be satisfied before implementing.
The Bottom Line
A/B testing is the most reliable way to make conversion optimization decisions — but only when done with proper statistical rigor: specific hypotheses, adequate sample sizes, full test duration without peeking, and analysis of both primary and secondary metrics. The businesses that generate consistent conversion improvement from A/B testing run many tests (50–100+ per year), document and learn from each one, and apply compounding knowledge from previous tests to inform future hypotheses. Start with high-traffic pages, test CTA copy and headlines first (highest win rate and impact), and commit to statistical best practices — it's tempting to stop at first promising results, but the data that matters is the data at your predetermined sample size.
At Scalify, we build professionally designed websites that provide a strong baseline for A/B testing — ensuring your conversion testing is optimizing from a solid foundation rather than fighting against fundamental design and UX problems.
Top 5 Sources
Advanced A/B Testing: Multivariate Testing and Personalization
Once simple A/B testing is producing consistent learnings, more sophisticated testing approaches add additional value:
Multivariate testing (MVT) tests multiple elements simultaneously across many variants — for example, testing 3 headline variations × 2 image variations × 2 CTA copy variations simultaneously creates 12 variants. MVT requires significantly more traffic than A/B testing (because statistical significance must be reached for each combination) but can identify interaction effects between elements that sequential A/B tests might miss. MVT is appropriate for high-traffic pages with well-established baseline conversion rates where the team has the bandwidth to analyze complex results.
Bandit testing (multi-armed bandit algorithms) automatically shifts traffic toward better-performing variants rather than maintaining a rigid 50/50 split. While this sacrifices some statistical precision, it reduces the "cost" of running losers during tests by limiting exposure to underperforming variants. Bandit testing is particularly appropriate for situations where the cost of the sub-optimal experience during the test is high — e-commerce checkout pages where losing conversion during a month-long test is expensive.
Personalization is A/B testing's more powerful sibling: rather than finding the one best version for all visitors, personalization shows different versions to different visitor segments simultaneously. A returning customer sees a different homepage than a first-time visitor. A visitor from a paid search ad sees a landing page tailored to their query. A mobile visitor sees a layout optimized for touch navigation. The statistical foundations are the same as A/B testing — but the potential for conversion improvement is higher because the optimal experience varies by visitor type.
Building a Testing Culture
The companies that produce the most consistent A/B testing results have made testing a cultural practice, not a project. The characteristics of a strong testing culture: every significant website change is treated as a testable hypothesis rather than a fait accompli; test results — including failed tests — are documented, shared, and referenced in future decisions; the team celebrates learning from failed tests rather than treating them as failures (a test that confirms the null hypothesis is valuable information); and testing velocity (number of tests per month) is tracked alongside win rate as a key metric. A team running 20 tests per month at a 30% win rate learns faster and compounds improvements more quickly than a team running 2 tests per month at a 50% win rate — volume produces knowledge faster than selectivity at this stage.
When Not to A/B Test
When traffic is too low. A page with fewer than 1,000 monthly visitors and a 2% conversion rate (20 conversions/month) cannot reach statistical significance for most tests in any reasonable timeframe. For low-traffic sites, qualitative research (user testing, surveys, heatmaps) produces more actionable insight than statistical testing that would take 12+ months to reach significance.
When the change is clearly needed. If user research, heatmaps, and session recordings all show that visitors are abandoning a broken form, don't A/B test whether to fix it — just fix it. A/B testing is for decisions where the outcome is genuinely uncertain; it's overkill for decisions where evidence already clearly points in one direction.
During seasonal peaks or promotional periods. Traffic behavior during Black Friday, end-of-year, or major promotions is atypical — tests run during these periods produce results that don't reflect baseline visitor behavior and can't be generalized to normal operating conditions. Pause testing during unusual periods and resume when traffic returns to baseline patterns.


.jpeg)

.jpeg)


78 SW 7th St, Miami, FL 33130


