


What Is CRO (Conversion Rate Optimization) and Why It Matters
By Josh Ternyak

April 17, 2026
CRO systematically increases the percentage of visitors who take desired actions, delivering 223% average ROI. This comprehensive guide covers the CRO process, highest-impact changes, CRO by website type (e-commerce, lead gen, SaaS), common mistakes, tools at each stage, the ROI case, building a CRO program, when CRO isn't the answer, and how CRO and SEO work together.
What Is CRO (Conversion Rate Optimization) and Why It Matters
Conversion Rate Optimization (CRO) is the systematic process of increasing the percentage of website visitors who take a desired action — making a purchase, filling out a contact form, signing up for a free trial, or any other goal that represents business value. CRO doesn't get more traffic; it makes better use of the traffic you already have. This is why it consistently delivers some of the highest ROI of any digital marketing discipline: you're improving the return on every marketing dollar already being spent.
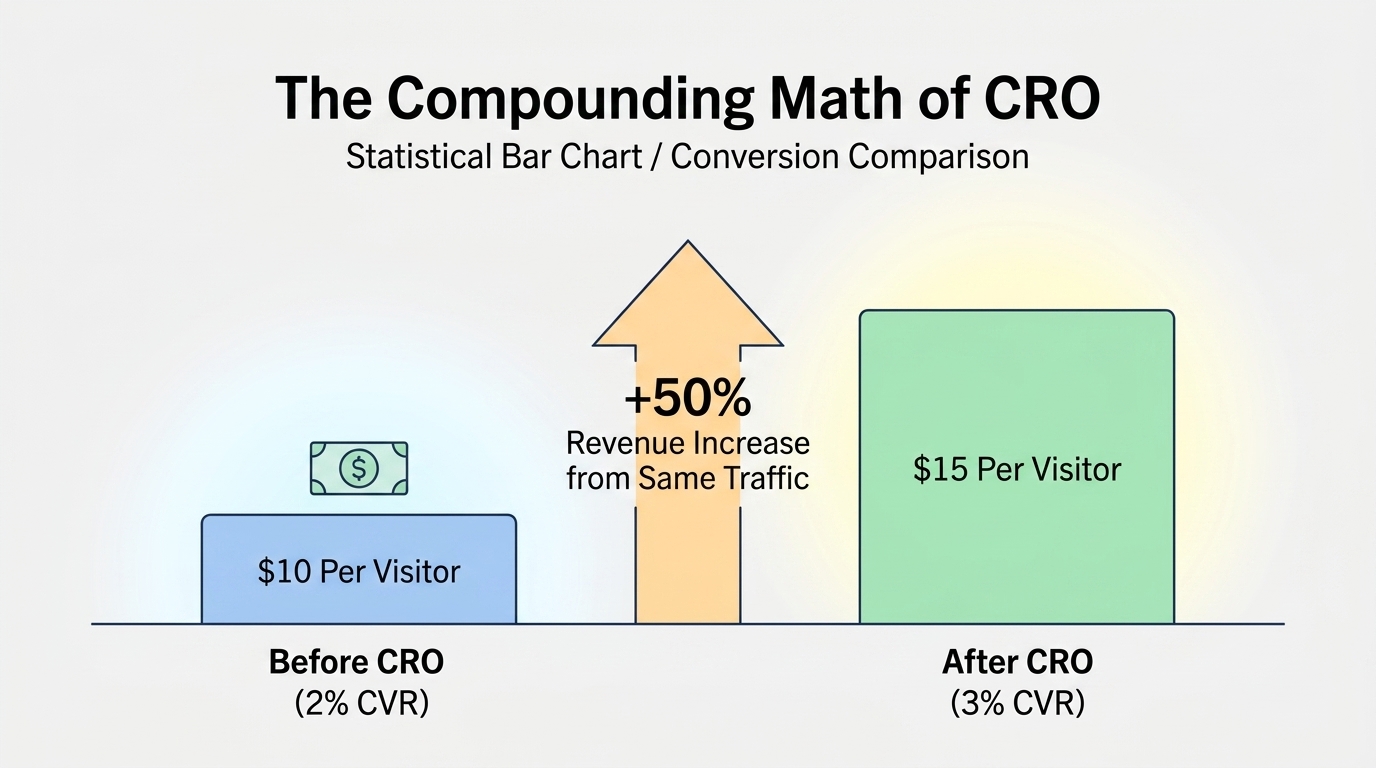
The basic math of CRO is compelling: if your website converts 2% of visitors into customers and your average order value is $500, you're generating $10 per visitor. If CRO improves your conversion rate to 3%, you're generating $15 per visitor — a 50% revenue increase from the same traffic. Every SEO dollar, every paid ad dollar, every email marketing dollar becomes 50% more productive without spending an additional cent on those channels.
.jpeg)
Key CRO Statistics
The CRO Process: How It Actually Works
StageActivitiesToolsOutput1. Data collection and analysisReview analytics, identify high-traffic low-conversion pages, track funnel drop-offsGoogle Analytics 4, MixpanelList of pages with highest improvement potential2. Qualitative researchSession recordings, heatmaps, user surveys, customer interviewsHotjar, Microsoft Clarity, TypeformUnderstanding of why visitors aren't converting3. Hypothesis formationBased on research, form specific, testable hypotheses about what to changeResearch synthesisPrioritized list of changes to test4. A/B testingTest one change at a time against control; run until statistical significanceVWO, Optimizely, AB Tasty, Google OptimizeStatistically valid winner/loser determination5. ImplementationDeploy winning variants permanently; document what was learnedCMS, developer, version controlPermanent conversion rate improvement6. IterationRaise the baseline; start the next test cycleAll of the aboveCompounding improvement over time
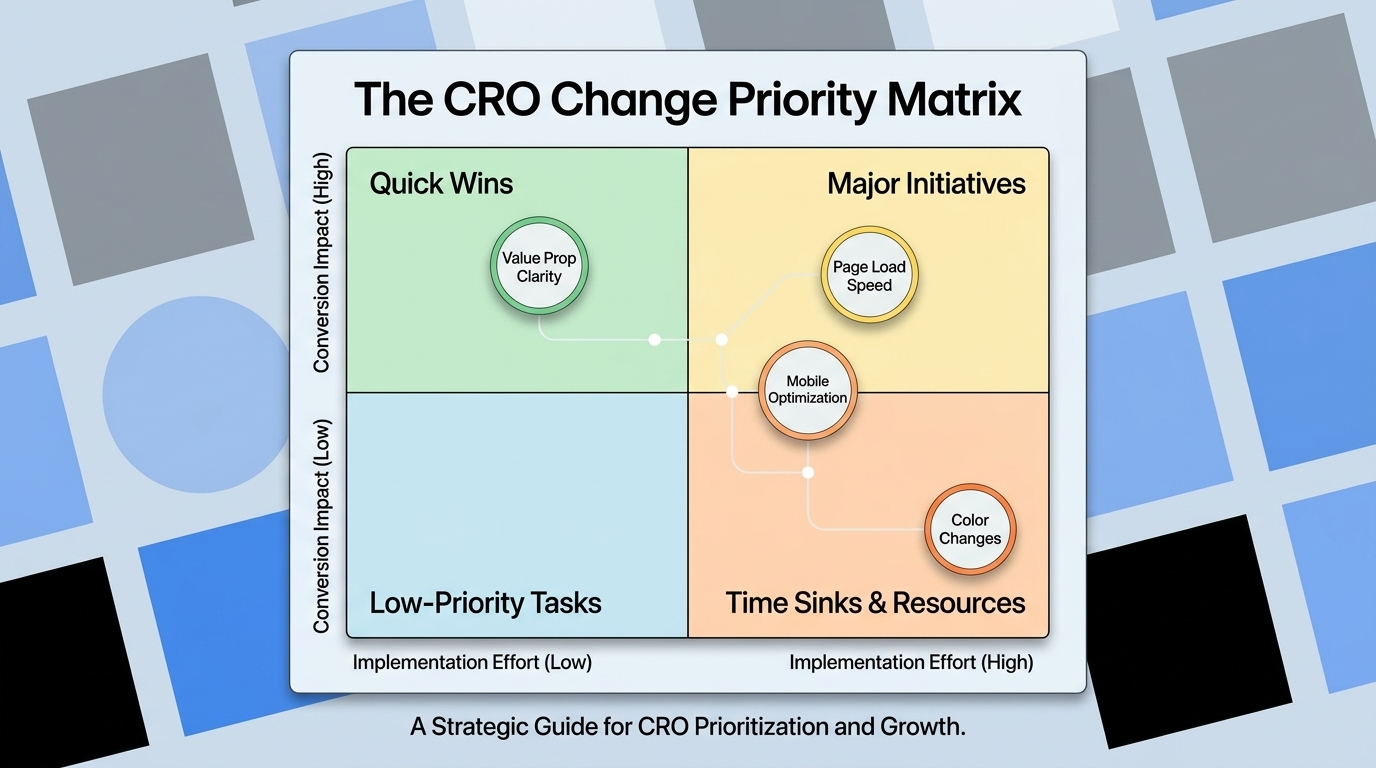
The Highest-Impact CRO Changes
CRO ChangeAverage ImpactEffortPriorityValue proposition clarity (headline rewrite)Very High — often 2–3xLowStart herePage load speed improvementHigh — 7% per second of delayMediumVery HighCTA copy and prominenceHigh — up to 2xLowVery HighSocial proof addition/improvementHigh — +15–34%Low-MediumHighForm length reductionMedium-High — 20–120% depending on reductionLowHighMobile experience optimizationHigh — 64% mobile CVR gapMediumHighTrust signal placementMedium — +7–18%LowMedium-HighPricing/offer clarityMedium-High — varies widelyLowMedium-HighNavigation simplificationMediumMediumMediumColor/visual design changesLow — rarely exceeds 5%HighLast resort
CRO for Different Website Types
E-Commerce CRO
E-commerce CRO focuses on three conversion stages: product page to add-to-cart, cart to checkout initiation, and checkout to purchase. Each stage has well-documented optimization opportunities. Product page optimization: high-quality multiple-angle photography, prominent star ratings with review counts, clear shipping cost and delivery timeline display, size/color selector that doesn't require page refresh, and mobile-optimized add-to-cart experience. Cart optimization: abandonment recovery email (captures 5–15% of abandoned carts), clear order summary with no surprise costs, and prominent display of return policy. Checkout optimization: guest checkout option (account creation requirement reduces checkout completion by 25–35%), minimal form fields, trusted payment method logos, and clear security indicators at card entry.
Lead Generation CRO
Lead generation websites convert when they clearly answer the visitor's core question — "will this solve my specific problem, and can I trust this company?" — before asking for contact information. The most impactful lead gen CRO improvements: rewriting the value proposition to be specific and outcome-oriented (what result do you produce for customers like me?), reducing form fields to the minimum required for the first contact (name, email, phone, brief message — not 15 qualification questions), adding specific client testimonials that match the target prospect's situation, and creating an exit-intent offer (free guide, consultation, audit) that captures prospects who aren't ready to submit the main form.
SaaS Free Trial CRO
SaaS trial conversion is primarily about reducing friction and setting accurate expectations. The most impactful SaaS CRO: remove credit card requirements from free trial signup (increases trials 20–40%), reduce signup form to email only (then gather more information during onboarding), add a demo video (increases trial starts 64%), display pricing on the marketing site (removes the prospect's need to inquire), and invest heavily in onboarding flow that helps users experience the product's core value within the first session. Many SaaS CRO programs focus too heavily on marketing site conversion while neglecting the trial-to-paid conversion that follows — optimizing both surfaces produces the best aggregate outcome.
Common CRO Mistakes
Testing too many things at once. Multi-variate testing can reveal which combination of changes performs best, but it doesn't reveal which individual change drove the improvement. Single-variable A/B tests are slower but produce actionable, transferable learning that multi-variate tests don't.
Declaring winners too early. Ending a test as soon as the data looks promising produces more false positives than complete tests. Tests need to run until they reach the pre-specified sample size, which in most cases means at least 2 weeks to capture weekly traffic pattern variation and 100+ conversions per variant.
Optimizing for the wrong metric. Optimizing for clicks or form fills without connecting to downstream business outcomes can produce conversion rate improvements that don't generate actual revenue. A form with 5 fields may get fewer submissions than one with 2 fields, but the 5-field submissions might convert to customers at 3x the rate, making the longer form more valuable despite lower initial conversion. Track the full conversion funnel.
Ignoring traffic quality before optimizing pages. If traffic is fundamentally mismatched to the offer — wrong audience, wrong intent stage, wrong geographic market — page optimization produces marginal improvements. Traffic quality is the multiplier that makes all CRO more valuable; address it before running page tests.
CRO Tools: What to Use at Each Stage
Tool CategoryOptionsPrice RangeBest ForAnalyticsGA4 (free), Mixpanel, AmplitudeFree–$500+/moUnderstanding traffic, conversion funnels, drop-off pointsSession recording / heatmapsHotjar, Microsoft Clarity (free), FullStoryFree–$200+/moUnderstanding user behavior qualitativelyA/B testingVWO, Optimizely, AB Tasty, Unbounce$100–$1,000+/moRunning controlled testsUser surveysTypeform, SurveyMonkey, Hotjar pollsFree–$100/moAsking visitors directly about friction pointsUser testingUserTesting.com, Maze, UsabilityHub$50–$500/testWatching real users attempt tasks on your siteForm analyticsHotjar, FormAnalytics, ZukoFree–$150/moIdentifying specific form fields causing abandonment
The ROI of CRO: Why It Outperforms Most Marketing Investments
The financial case for CRO investment is unusually strong because its benefits compound across all traffic sources simultaneously. When a landing page's conversion rate improves from 2% to 3%, that improvement applies to organic traffic, paid traffic, email traffic, and referral traffic simultaneously. A 50% conversion rate improvement effectively produces the same revenue impact as a 50% traffic increase — but the conversion improvement is permanent and doesn't require ongoing spend, while the traffic increase requires ongoing investment to maintain. This compounding, permanent nature of CRO improvements is why the documented 223% average ROI on CRO investment is credible: the investment is made once, but the benefit accrues indefinitely on every future visitor.
The Bottom Line
CRO is the discipline of making your existing traffic more valuable — and it consistently delivers higher ROI than equivalent investment in additional traffic acquisition. The process is systematic: data analysis to find high-value optimization targets, qualitative research to understand why visitors aren't converting, A/B testing to validate specific changes, and iterative improvement that compounds over time. Start with value proposition clarity, page load speed, and CTA prominence — the highest-impact, lowest-effort changes available — and build from there based on what the data shows about your specific audience and offer.
At Scalify, every website we build is conversion-architected from day one — clear value propositions, prominent CTAs, social proof placement, and the technical performance that ensures CRO efforts aren't undermined by slow load times.
Top 5 Sources
Building a CRO Program: From One-Off Tests to Systematic Improvement
The difference between companies that see sustained conversion rate improvement and those that run a few tests with mixed results is almost always program structure rather than testing methodology. A CRO program — as opposed to ad hoc conversion testing — has defined processes, regular cadences, and institutional learning that make each successive test more informed and more likely to produce positive results than the last.
A minimum viable CRO program for a growing business looks like this: a dedicated CRO meeting cadence (bi-weekly or monthly) where the team reviews current test results and proposes next tests, a central hypothesis log documenting every test run with its setup, results, and learnings (so insights compound rather than being forgotten), a defined threshold for statistical significance (typically 95% confidence) that prevents premature test conclusions, and a consistent analysis framework connecting test results to actual revenue impact rather than just conversion rate changes.
More mature CRO programs add user research velocity (running user tests monthly rather than quarterly), personalization layers (showing different content to different visitor segments rather than running single universal tests), and integration with product development cycles (CRO learnings informing product roadmap decisions). The most sophisticated CRO programs at high-traffic e-commerce sites and SaaS companies run 10–20 simultaneous tests across different pages and user segments, review results weekly, and compound improvements at rates that produce dramatically higher conversion rates within 12–18 months than any single well-run test could achieve alone.
When CRO Isn't the Answer
CRO is not the right investment at every stage of a website's development. There are specific situations where CRO investment produces poor returns and other priorities should take precedence:
When traffic is too low to reach statistical significance. A website with 500 monthly visitors and 15 conversions cannot run meaningful A/B tests — the sample size is too small to distinguish real improvement from random variation. Before investing in CRO testing infrastructure, build the traffic base that makes testing statistically viable. For most websites, this means at least 1,000–2,000 monthly visits and 50–100 monthly conversions on the pages being tested.
When the product-market fit is unclear. If a significant portion of the bounce rate on your website comes from visitors who found the right page but decided the offer wasn't relevant to their needs — product-market fit problem, not a CRO problem. Optimize the offer before optimizing the conversion of the wrong offer.
When technical foundations are broken. A website with poor mobile experience, 6-second load times on mobile, and broken forms on certain browsers has technical problems that dwarf any CRO improvement. Fix the technical foundation before running A/B tests on button colors.
CRO and SEO: The Synergy
CRO and SEO are mutually reinforcing disciplines that produce better results when coordinated than when operated in silos. SEO drives more qualified traffic to pages that CRO has optimized to convert more of that traffic — and the improvements compound. More practically: CRO learnings about which value propositions resonate with visitors inform SEO content strategy (write more content that emphasizes the angles that convert); SEO keyword research informs CRO hypothesis formation (visitors from "best [product type]" queries expect different content than visitors from "how to [problem]" queries); and page speed improvements made for Core Web Vitals SEO directly improve the conversion rate that CRO is trying to optimize. Teams that integrate CRO and SEO planning consistently outperform teams that run each discipline independently with separate goals and separate metrics.


.jpeg)

.jpeg)


78 SW 7th St, Miami, FL 33130


